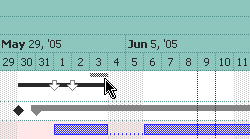
Retrieves or sets a value that indicates whether the control draws a ticker around the current date while cursor hovers the chart's client area.
Type
Description
Boolean
A Boolean expression that indicates whether the date ticker is visible or
hidden.
By default, the
DrawDateTicker property is False. Use the DrawDateTicker property to show or hide
the ticker that
shows up while the cursor hovers the chart's area. The ticker indicates the
size and position of the focused bar while it is resized or moved. The DateTickerLabel
property specifies the label (being displayed across the ticker) that shows
the start and end dates of the moved or resized bar. Use the DateFromPoint
property to retrieve the date from the cursor. Use the NonworkingDays
property to specify the nonworking days. Use the MarkTodayColor
property to specify whether the today date is marked. Use the DrawTickLines property to
specify whether the grid lines between time units in the level are visible or
hidden. The DateTickerLabel property
shows the start and end date of the bar being moved or resized.
Your application can provide some options to help user while performing
moving or resizing the bars at runtime as follow:
grid lines, that can be shown only
when moving or resizing, using the ChartStartChanging and ChartEndChanging
events
select date, to specify the
margins of the area you want to highlight
ticker, that shows the cursor's position in the chart, or while
resizing, it shows the size and the position of the bar
ability to specify a resizing/moving
unit, different that the displayed one ie while the chart displays
days, you can specify the resizing unit on hours.
inside zoom, that can be used to
magnify the portion of the chart being selected