Please follow the steps in order to view your bars in the histogram.
- Changes the HistogramVisible property on True ( by default, it is False ). After setting the HistogramVisible property on True, the control shows a horizontal splitter in the bottom side of the control.
- Adjusts the height of the histogram view using the HistogramHeight property ( by default it is 0 ). After setting the HistogramHeight property on a value greater than 0, the control shows a the histogram view in the bottom side of the control.
- Changes the HistogramPattern or/and HistogramColor
property, else no bars will be shown in the histogram. The
HistogramPattern/HistogramColor properties belong to a Bar
object. For instance the Chart.Bars("Task").HistogramPattern =
exPatternDot, specifies that the Task bars will be represented in the histogram
using the
exPatternDot pattern (
 )
)
The followings are optional properties that you can set in order to customize your histogram:
- The HistogramType property indicates the type of the histogram being displayed for a specified bar.
- Use the HistogramView property to specify the items being represented in the histogram view. By default, only visible items are displayed in the histogram. For instance, using the HistogramView property you can select the items being represented in the histogram
- Use the HistogramBackColor property to specify the histogram's background color.
The following screen shot shows the bar's diagram if the HistogramPattern property is exPatternBDiagonal. This histogram shows the diagram using a predefined patterns ( value should be greater than 1 and less then 255 ).

( HistogramPattern value from 1 to 255 )
The following screen shot shows the bar's diagram if the HistogramColor property points an EBN object ( 0x01000000, defines the EBN object being used to show the task bars ). In case the HistogramColor property points to an EBN/Skin object ( the first 7 bites of the color are used ) the HistogramPattern property has no effect, so the EBN object is used to show the diagram.
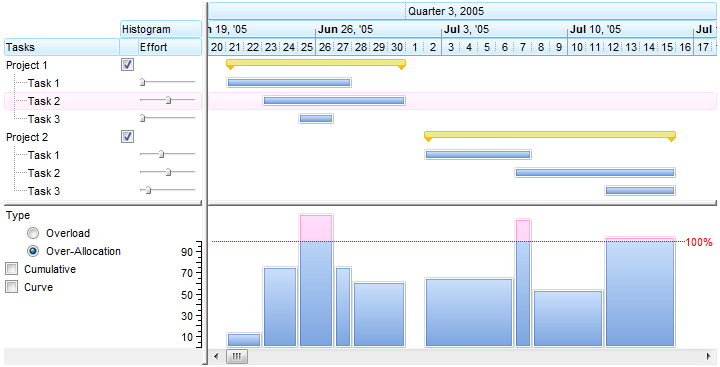
( HistogramColor defines the EBN/Skin object, HistogramPattern does not count )
The following screen shot shows the bar's diagram if the HistogramColor property points an EBN object ( 0x01000000, defines the EBN object being used to show headers )
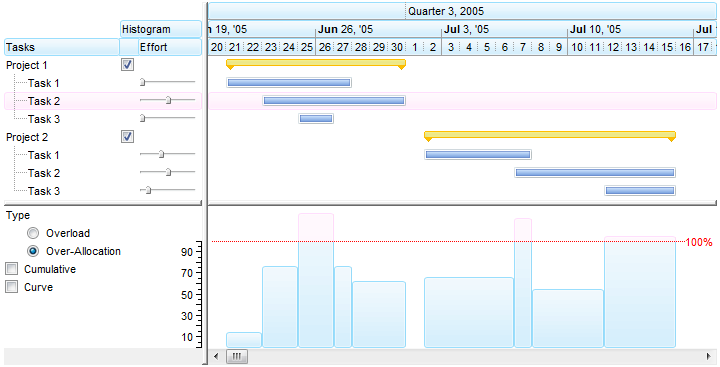
( HistogramColor defines the EBN/Skin file used, HistogramPattern does not count )
The following screen shot shows the bar's diagram if the HistogramPattern property is exPolygonCurve + exPatternYard
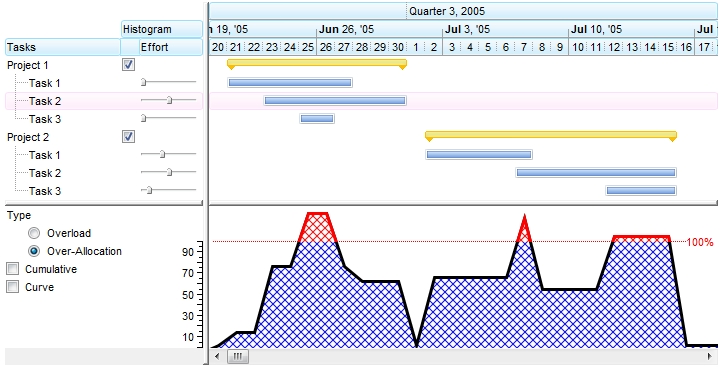
( HistogramPattern value is 256 + value from (1 to 255) )
The following screen shot shows the bar's diagram if the HistogramPattern property is exPolygonCurve + exPatternEmpty, or simple exPolygonCurve
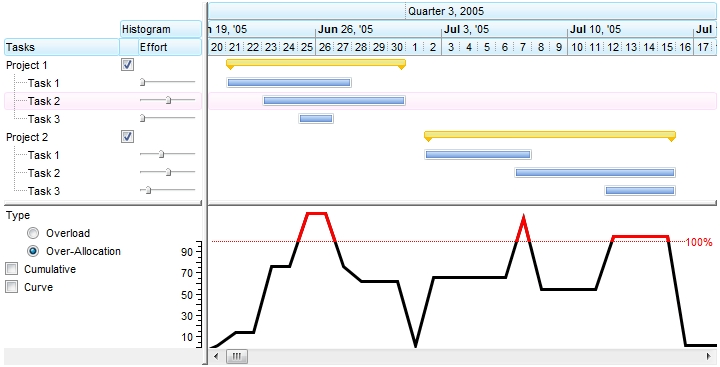
( HistogramPattern value is 256 )
The following screen shot shows the bar's diagram if the HistogramPattern property is exPolygonCurve + exPatternEmpty, or simple exPolygonCurve, the AntiAliasing property is True, and the HistogramColor and HistogramBorderColor propertis have different values.

( HistogramPattern value is 256, AntiAliasing = True, HistogramColor != HistogramBorderColor )
The following screen shot shows the bar's diagram if the HistogramPattern property is exRectangularCurve + exPatternYard
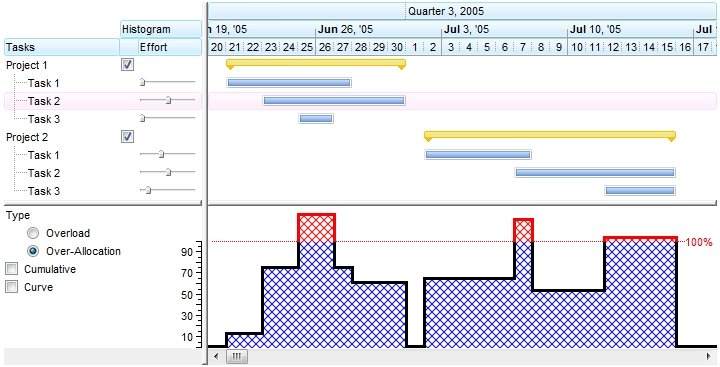
( HistogramPattern value is 2048 + value from (1 to 255) )
The following screen shot shows the bar's diagram if the HistogramPattern property is exRectangularCurve + exPatternEmpty, or simple exRectangularCurve
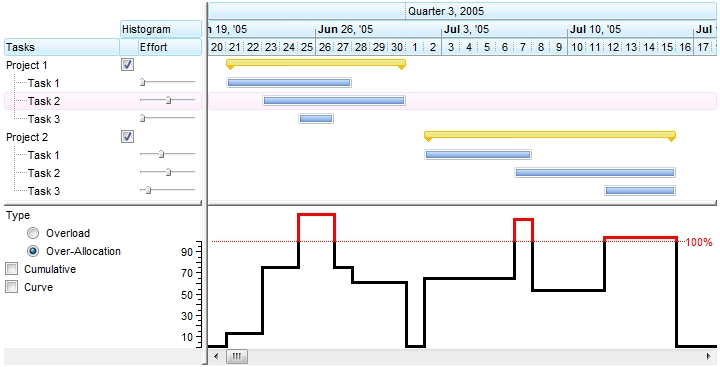
( HistogramPattern value is 2048 )
The following screen shot shows the bar's diagram if the HistogramPattern property is exRectangularCurve + exPatternEmpty, or simple exRectangularCurve, the AntiAliasing property is True, and the HistogramColor and HistogramBorderColor propertis have different values.

( HistogramPattern value is 2048, AntiAliasing = True, HistogramColor != HistogramBorderColor )
The following screen shot shows the bar's diagram if the HistogramPattern property is exBezierCurve + exPatternYard
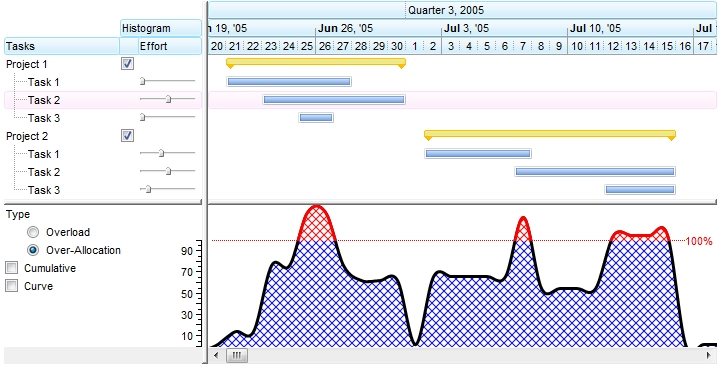
( HistogramPattern value is 512 + value from (1 to 255) )
The following screen shot shows the bar's diagram if the HistogramPattern property is exBezierCurve + exPatternEmpty, or simple exBezierCurve
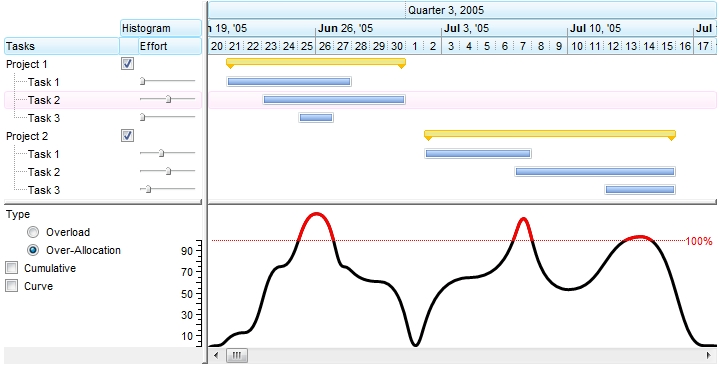
( HistogramPattern value is 512 )
The following screen shot shows the bar's diagram if the HistogramPattern property is exBezierCurve + exPatternEmpty, or simple exBezierCurve, the AntiAliasing property is True, and the HistogramColor and HistogramBorderColor propertis have different values.

( HistogramPattern value is 512, AntiAliasing = True, HistogramColor != HistogramBorderColor )
The following screen shot shows the bar's diagram if the HistogramPattern property is exRoundCurve + exPatternYard
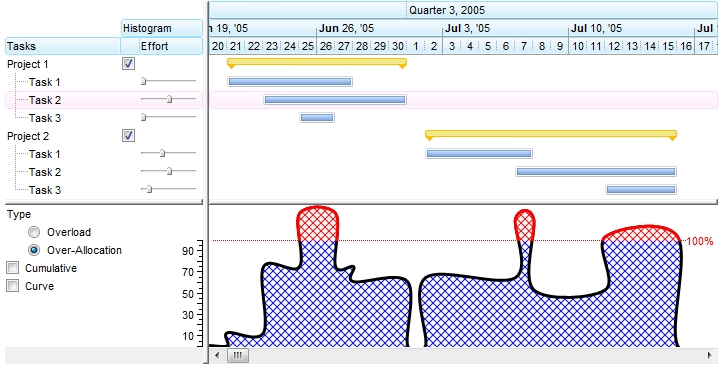
( HistogramPattern value is 1024 + value from (1 to 255) )
The following screen shot shows the bar's diagram if the HistogramPattern property is exRoundCurve + exPatternEmpty, or simple exRoundCurve
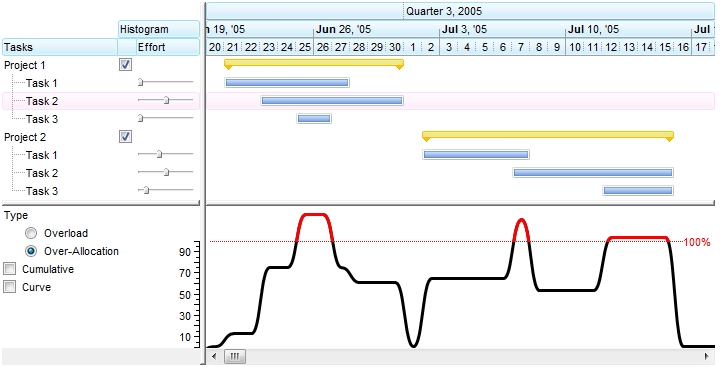
( HistogramPattern value is 1024 )
The following screen shot shows the bar's diagram if the HistogramPattern property is exRoundCurve + exPatternEmpty, or simple exRoundCurve, the AntiAliasing property is True, and the HistogramColor and HistogramBorderColor propertis have different values.

( HistogramPattern value is 1024, AntiAliasing = True, HistogramColor != HistogramBorderColor )
The following screen shot shows the bar's diagram if the HistogramPattern property is exPatternShadow, the HistogramType property includes the exHistCumulative flag, and the HistogramCumulativeOriginalColorBars property is False.
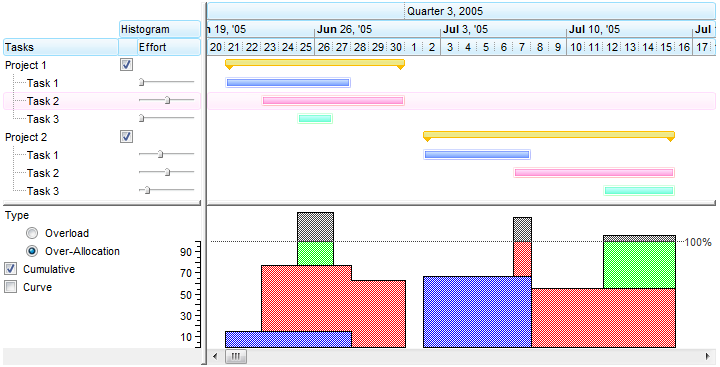
( HistogramPattern value is between 1 and 255 and HistogramType property includes the exHistCumulative flag )
If the HistogramPattern property is a predefined value, the PatternEnum type specifies the shape of the histogram as shown bellow ( exPatternDot, exPatternBox and exPatternEmpty ):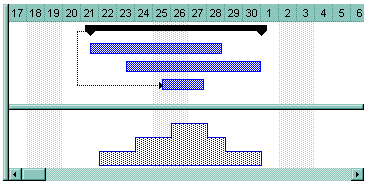
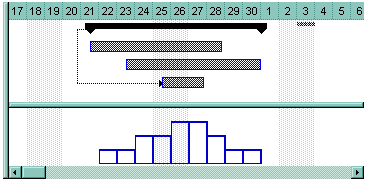
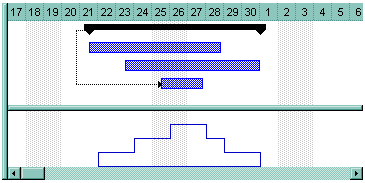
- If the HistogramPattern
property is 256, the rectangular curves shows the overloads and subloads of
the bar in the specified range of data as follows:
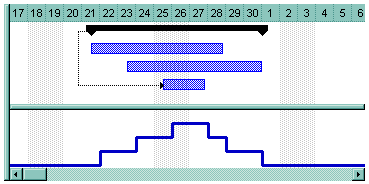
-
If the HistogramPattern is 256 plus a predefined PatternEnum value, the histogram shows like follows ( in this case the HistogramPattern property is 256 + exPatternVertical = 264 ):
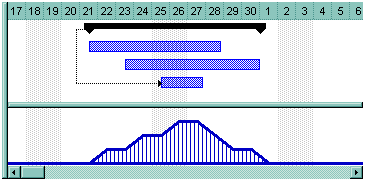
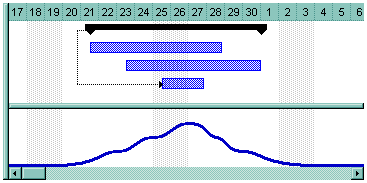
- If the HistogramPattern property is
512, the bezier curves shows the overloads and subloads of the bar in the
specified range of data as follows:
-
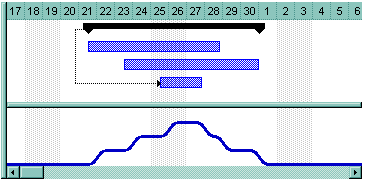
If the HistogramPattern property is 1024, the round curves shows the overloads and subloads of the bar in the specified range of data as follows:
Bellow you can find how histogram is updated automatically as soon as the user moves or resizes a bar:

Use the HistogramVisible property to show or hide the histogram. Use the HistogramHeight property to specify at runtime the height of the histogram.


