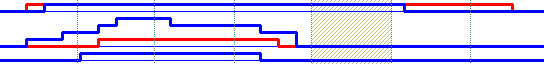
By default, the HistogramColor property is identical with the Color property. By default, no bar is represented in the histogram. A bar is represented in the histogram only if HistogramPattern or HistogramColor property is set. Use the HistogramColor property to define the color of the pattern or the skin object to be displayed in the histogram. Use the HistogramType property to specify the type of the graph to be displayed in the histogram for specified bar. Use the HistogramBackColor property to specify the histogram's background color. Use the HistogramVisible property to show or hide the histogram. Use the HistogramHeight property to specify at runtime the height of the histogram. The ResizeUnitScale property determines the refinement for the histogram part. For instance, if the chart displays days, while the bars are represented up to hours, the ResizeUnitScale property on exHour, will determine the histogram to show up to hours.
Please follow the steps in order to view your bars in the histogram.
- Changes the HistogramVisible property on True ( by default, it is False ). After setting the HistogramVisible property on True, the control shows a horizontal splitter in the bottom side of the control.
- Adjusts the height of the histogram view using the HistogramHeight property ( by default it is 0 ). After setting the HistogramHeight property on a value greater than 0, the control shows a the histogram view in the bottom side of the control.
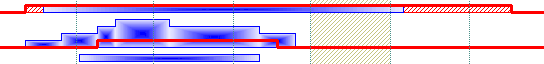
- Changes the HistogramPattern
or/and HistogramColor property, else no bars will be shown in the
histogram. The HistogramPattern/HistogramColor properties belong to a Bar
object. For instance the Chart.Bars("Task").HistogramPattern =
exPatternDot, specifies that the Task bars will be represented in the histogram
using the
exPatternDot pattern (
 )
)
The followings are optional properties that you can set in order to customize your histogram:
- The HistogramType property indicates the type of the histogram being displayed for a specified bar.
- Use the HistogramView property to specify the items being represented in the histogram view. By default, only visible items are displayed in the histogram. For instance, using the HistogramView property you can select the items being represented in the histogram
- Use the HistogramBackColor property to specify the histogram's background color.