|
194
|
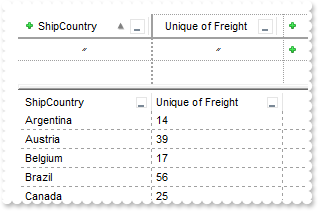
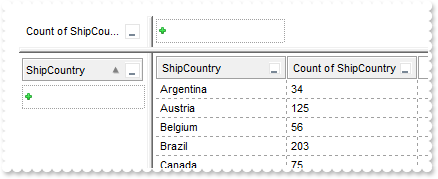
Is there a way to do a count but not a count of records but of distinct values
With AxPivot1
	.Import("C:\Program Files\Exontrol\ExPivot\Sample\data.txt")
	.PivotRows = "0"
	.PivotColumns = "unique(5)"
End With
|
|
193
|
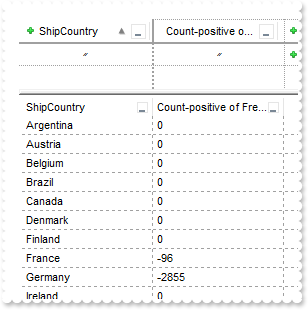
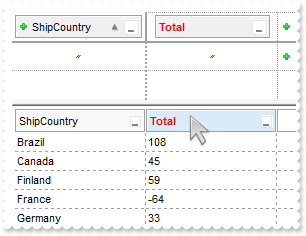
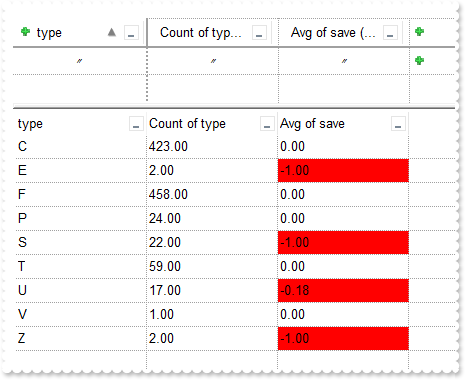
Adds negative values only (method 2)
With AxPivot1
	.Import("C:\Program Files\Exontrol\ExPivot\Sample\data.txt")
	.Aggregates.Add("sumN","sum","sumN","Count-positive").FormatValue = "value < 0 ? value : 0"
	.PivotRows = "0"
	.PivotColumns = "sumN(5)"
End With
|
|
192
|
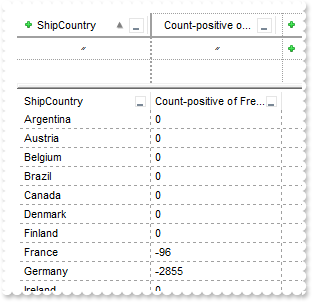
Adds negative values only (method 1)
With AxPivot1
	.Import("C:\Program Files\Exontrol\ExPivot\Sample\data.txt")
	.Aggregates.Add("sumN","dbl(pvalue) + (dbl(value) < 0 ? dbl(value) : 0)","sumN","Count-positive")
	.PivotRows = "0"
	.PivotColumns = "sumN(5)"
End With
|
|
191
|
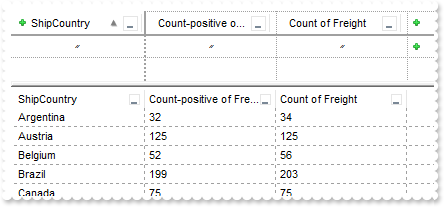
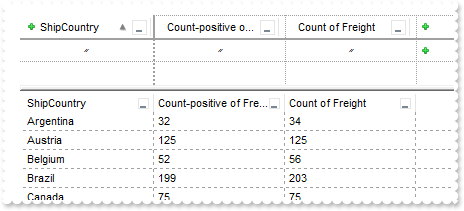
Counts positive value only (method 2)
With AxPivot1
	.Import("C:\Program Files\Exontrol\ExPivot\Sample\data.txt")
	.Aggregates.Add("countP","sum","countP","Count-positive").FormatValue = "value > 0 ? 1 : 0"
	.PivotRows = "0"
	.PivotColumns = "countP(5),count(5)"
End With
|
|
190
|
Counts positive value only (method 1)
With AxPivot1
	.Import("C:\Program Files\Exontrol\ExPivot\Sample\data.txt")
	.Aggregates.Add("countP","dbl(pvalue) + (dbl(value) > 0 ? 1 : 0)","countP","Count-positive")
	.PivotRows = "0"
	.PivotColumns = "countP(5),count(5)"
End With
|
|
189
|
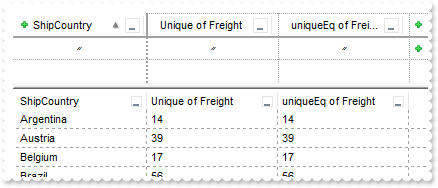
Equivalent of UNIQUE aggregate using expression
With AxPivot1
	.Import("C:\Program Files\Exontrol\ExPivot\Sample\data.txt")
	.Aggregates.Add("uniqueEq","pvalue + ((pvalue contains (';' + value + `;`)) ? `` : (';' + value + `;`))","uniqueEq","uniqueEq").FormatResult = "(value count `;`)/2"
	.PivotRows = "0"
	.PivotColumns = "unique(5),uniqueEq(5)"
End With
|
|
188
|
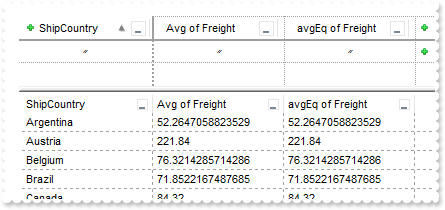
Equivalent of AVG aggregate using expression
With AxPivot1
	.Import("C:\Program Files\Exontrol\ExPivot\Sample\data.txt")
	.Aggregates.Add("avgEq","dbl(pvalue) + dbl(value)","avgEq","avgEq").FormatResult = "value / vcount"
	.PivotRows = "0"
	.PivotColumns = "avg(5),avgEq(5)"
End With
|
|
187
|
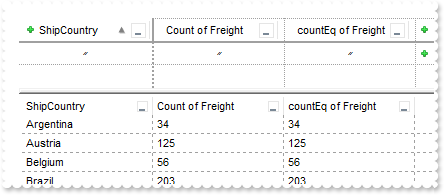
Equivalent of COUNT aggregate using expression
With AxPivot1
	.Import("C:\Program Files\Exontrol\ExPivot\Sample\data.txt")
	.Aggregates.Add("countEq","pvalue + 1","countEq","countEq")
	.PivotRows = "0"
	.PivotColumns = "count(5),countEq(5)"
End With
|
|
186
|
Equivalent of SUM aggregate using expression
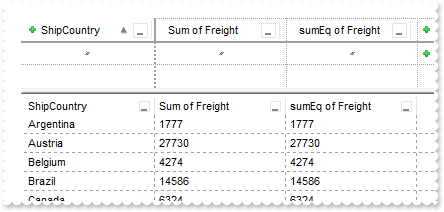
With AxPivot1
	.Import("C:\Program Files\Exontrol\ExPivot\Sample\data.txt")
	.Aggregates.Add("sumEq","dbl(pvalue) + dbl(value)","sumEq","sumEq")
	.PivotRows = "0"
	.PivotColumns = "sum(5),sumEq(5)"
End With
|
|
185
|
Disable chart stacking
' ViewChange event - Occurs when the control's view is changed, such as when data is updated, summarized, sorted, or filtered.
Private Sub AxPivot1_ViewChange(ByVal sender As System.Object, ByVal e As System.EventArgs) Handles AxPivot1.ViewChange
	With AxPivot1
		.CustomView.Object.AllowStack = False
	End With
End Sub

With AxPivot1
	.BeginUpdate()
	.HeaderHeight = 24
	.HeaderAppearance = EXPIVOTLib.AppearanceEnum.Etched
	.Import("C:\Program Files\Exontrol\ExPivot\Sample\data.txt")
	.PivotColumnsFloatBarVisible = EXPIVOTLib.PanelVisibleEnum.exPanelVisible
	.PivotRows = "0"
	.PivotColumns = "sum(5)/12"
	.ShowBranchRows = EXPIVOTLib.ShowBranchRowsEnum.exBranchColumns
	.PivotBarVisible = EXPIVOTLib.PivotBarVisibleEnum.exPivotBarSingleAggregate Or EXPIVOTLib.PivotBarVisibleEnum.exPivotBarDefault
	.CustomView.ControlID = "exontrol.graph"
	.EndUpdate()
End With
|
|
184
|
Can the vertical/horizontal line be hidden when the cursor hovers over the graph chart
With AxPivot1
	.BeginUpdate()
	.HeaderHeight = 24
	.HeaderAppearance = EXPIVOTLib.AppearanceEnum.Etched
	.Import("C:\Program Files\Exontrol\ExPivot\Sample\data.txt")
	.PivotColumnsFloatBarVisible = EXPIVOTLib.PanelVisibleEnum.exPanelVisible
	.PivotRows = "0"
	.PivotColumns = "sum(5)/12"
	.ShowBranchRows = EXPIVOTLib.ShowBranchRowsEnum.exBranchColumns
	.PivotBarVisible = EXPIVOTLib.PivotBarVisibleEnum.exPivotBarSingleAggregate Or EXPIVOTLib.PivotBarVisibleEnum.exPivotBarDefault
	With .CustomView
		.License = "XXXXXXXX"
		.ControlID = "exontrol.graph"
		.Object.Cursor.Visible = False
	End With
	.EndUpdate()
End With
|
|
183
|
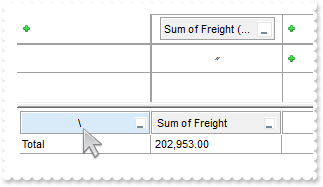
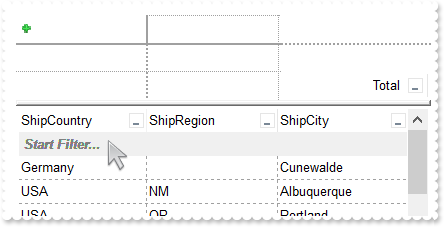
Define the column caption and row title when the PivotRows property is empty
With AxPivot1
	.BeginUpdate()
	.HeaderHeight = 24
	.HeaderAppearance = EXPIVOTLib.AppearanceEnum.Etched
	.set_Description(EXPIVOTLib.DescriptionTypeEnum.exColumnEmptyPivotRows,"<c>\")
	.set_Description(EXPIVOTLib.DescriptionTypeEnum.exRowEmptyPivotRows,"Total")
	.Import("C:\Program Files\Exontrol\ExPivot\Sample\data.txt")
	.PivotColumnsFloatBarVisible = EXPIVOTLib.PanelVisibleEnum.exPanelAsChild
	.PivotColumns = "sum(5)[content=numeric]"
	.ShowBranchRows = EXPIVOTLib.ShowBranchRowsEnum.exBranchColumns
	.DrawGridLines = EXPIVOTLib.GridLinesEnum.exRowLines
	.GridLineStyle = EXPIVOTLib.GridLinesStyleEnum.exGridLinesSolid
	.EndUpdate()
End With
|
|
182
|
Change the background color of the splitbars
With AxPivot1
	.BeginUpdate()
	.set_Background(EXPIVOTLib.BackgroundPartEnum.exHSplitBar,15790320)
	.set_Background(EXPIVOTLib.BackgroundPartEnum.exCSplitBar,15790320)
	.HeaderHeight = 24
	.HeaderAppearance = EXPIVOTLib.AppearanceEnum.Etched
	.Import("C:\Program Files\Exontrol\ExPivot\Sample\data.txt")
	.PivotColumnsFloatBarVisible = EXPIVOTLib.PanelVisibleEnum.exPanelAsChild
	.PivotRows = "0"
	.PivotColumns = "sum(5)/12"
	.ShowBranchRows = EXPIVOTLib.ShowBranchRowsEnum.exBranchColumns
	.PivotBarVisible = EXPIVOTLib.PivotBarVisibleEnum.exPivotBarSingleAggregate Or EXPIVOTLib.PivotBarVisibleEnum.exPivotBarDefault
	.DrawGridLines = EXPIVOTLib.GridLinesEnum.exVLines
	.EndUpdate()
End With
|
|
181
|
Occurs when the control's view is changed, such as when data is updated, summarized, sorted, or filtered
' ViewChange event - Occurs when the control's view is changed, such as when data is updated, summarized, sorted, or filtered.
Private Sub AxPivot1_ViewChange(ByVal sender As System.Object, ByVal e As System.EventArgs) Handles AxPivot1.ViewChange
	With AxPivot1
		Debug.Print( .CustomView.Columns )
	End With
End Sub

With AxPivot1
	.HeaderHeight = 24
	.HeaderAppearance = EXPIVOTLib.AppearanceEnum.Etched
	.GridLineStyle = EXPIVOTLib.GridLinesStyleEnum.exGridLinesGeometric
	.Import("C:\Program Files\Exontrol\ExPivot\Sample\data.txt")
	.PivotColumns = "sum(5)/12"
End With
|
|
180
|
Retrieves the data information about the current view, such as columns, data, ...
' ViewChange event - Occurs when the control's view is changed, such as when data is updated, summarized, sorted, or filtered.
Private Sub AxPivot1_ViewChange(ByVal sender As System.Object, ByVal e As System.EventArgs) Handles AxPivot1.ViewChange
	With AxPivot1
		With .CustomView
			Debug.Print( "Columns" )
			Debug.Print( .Columns )
			Debug.Print( "Items" )
			Debug.Print( .Items )
			Debug.Print( "Categories" )
			Debug.Print( .Categories )
			Debug.Print( "Series" )
			Debug.Print( .Series )
			Debug.Print( "Data" )
			Debug.Print( .Data )
		End With
	End With
End Sub

Dim var_CustomView
With AxPivot1
	.BeginUpdate()
	.HeaderHeight = 24
	.HeaderAppearance = EXPIVOTLib.AppearanceEnum.Etched
	.Import("C:\Program Files\Exontrol\ExPivot\Sample\data.txt")
	.PivotColumnsFloatBarVisible = EXPIVOTLib.PanelVisibleEnum.exPanelVisible
	.PivotRows = "0"
	.PivotColumns = "sum(5)"
	.ShowBranchRows = EXPIVOTLib.ShowBranchRowsEnum.exBranchColumns
	.PivotBarVisible = EXPIVOTLib.PivotBarVisibleEnum.exPivotBarSingleAggregate Or EXPIVOTLib.PivotBarVisibleEnum.exPivotBarDefault
	var_CustomView = .CustomView
	.EndUpdate()
End With
|
|
179
|
Access the custom-view
With AxPivot1
	.BeginUpdate()
	.HeaderHeight = 24
	.HeaderAppearance = EXPIVOTLib.AppearanceEnum.Etched
	.Import("C:\Program Files\Exontrol\ExPivot\Sample\data.txt")
	.PivotColumnsFloatBarVisible = EXPIVOTLib.PanelVisibleEnum.exPanelVisible
	.PivotRows = "0"
	.PivotColumns = "sum(5)"
	.ShowBranchRows = EXPIVOTLib.ShowBranchRowsEnum.exBranchColumns
	.PivotBarVisible = EXPIVOTLib.PivotBarVisibleEnum.exPivotBarSingleAggregate Or EXPIVOTLib.PivotBarVisibleEnum.exPivotBarDefault
	With .CustomView
		.ControlID = "exontrol.graph"
		.Object.ForeColor = RGB(128,128,128)
	End With
	.EndUpdate()
End With
|
|
178
|
Switch between custom view and table mode
' OleEvent event - Occurs whenever the custom view fires an event.
Private Sub AxPivot1_OleEvent(ByVal sender As System.Object, ByVal e As AxEXPIVOTLib._IPivotEvents_OleEventEvent) Handles AxPivot1.OleEvent
	With AxPivot1
		.CustomView.Visible = False
	End With
End Sub

With AxPivot1
	.BeginUpdate()
	.HeaderHeight = 24
	.HeaderAppearance = EXPIVOTLib.AppearanceEnum.Etched
	.Import("C:\Program Files\Exontrol\ExPivot\Sample\data.txt")
	.PivotColumnsFloatBarVisible = EXPIVOTLib.PanelVisibleEnum.exPanelVisible
	.PivotRows = "0"
	.PivotColumns = "sum(5)"
	.ShowBranchRows = EXPIVOTLib.ShowBranchRowsEnum.exBranchColumns
	.PivotBarVisible = EXPIVOTLib.PivotBarVisibleEnum.exPivotBarSingleAggregate Or EXPIVOTLib.PivotBarVisibleEnum.exPivotBarDefault
	.CustomView.ControlID = "exontrol.graph"
	.EndUpdate()
End With
|
|
177
|
'exontrol.graph' component creation failed
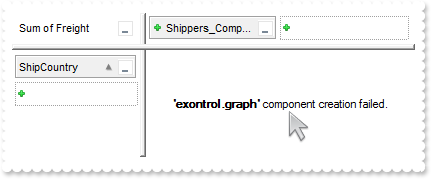
With AxPivot1
	.BeginUpdate()
	.HeaderHeight = 24
	.HeaderAppearance = EXPIVOTLib.AppearanceEnum.Etched
	.Import("C:\Program Files\Exontrol\ExPivot\Sample\data.txt")
	.PivotColumnsFloatBarVisible = EXPIVOTLib.PanelVisibleEnum.exPanelVisible
	.PivotRows = "0"
	.PivotColumns = "sum(5)/12"
	.ShowBranchRows = EXPIVOTLib.ShowBranchRowsEnum.exBranchColumns
	.PivotBarVisible = EXPIVOTLib.PivotBarVisibleEnum.exPivotBarSingleAggregate Or EXPIVOTLib.PivotBarVisibleEnum.exPivotBarDefault
	With .CustomView
		.License = "XXXXXXXX"
		.ControlID = "exontrol.graph"
	End With
	.EndUpdate()
End With
|
|
176
|
How can I change the graphical/chart representation of my data
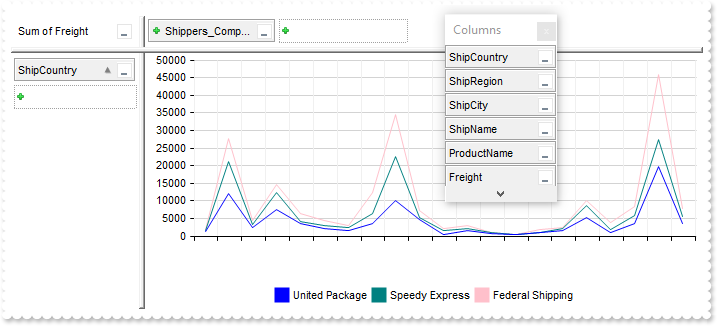
With AxPivot1
	.BeginUpdate()
	.HeaderHeight = 24
	.HeaderAppearance = EXPIVOTLib.AppearanceEnum.Etched
	.Import("C:\Program Files\Exontrol\ExPivot\Sample\data.txt")
	.PivotColumnsFloatBarVisible = EXPIVOTLib.PanelVisibleEnum.exPanelVisible
	.PivotRows = "0"
	.PivotColumns = "sum(5)/12"
	.ShowBranchRows = EXPIVOTLib.ShowBranchRowsEnum.exBranchColumns
	.PivotBarVisible = EXPIVOTLib.PivotBarVisibleEnum.exPivotBarSingleAggregate Or EXPIVOTLib.PivotBarVisibleEnum.exPivotBarDefault
	With .CustomView
		.ControlID = "exontrol.graph"
		.Object.SerieType = "line"
	End With
	.EndUpdate()
End With
|
|
175
|
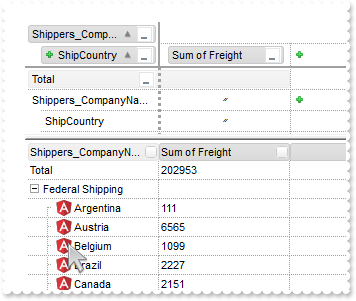
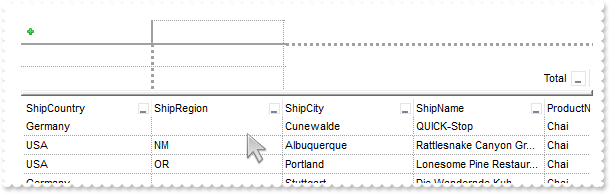
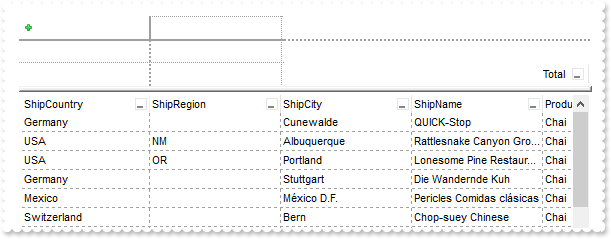
Organizes the layout into distinct sections: one for pivot rows, one for pivot columns, and a separate area for defining aggregates
With AxPivot1
	.BeginUpdate()
	.HeaderHeight = 24
	.HeaderAppearance = EXPIVOTLib.AppearanceEnum.Etched
	.Import("C:\Program Files\Exontrol\ExPivot\Sample\data.txt")
	.PivotColumnsFloatBarVisible = EXPIVOTLib.PanelVisibleEnum.exPanelAsChild
	.ShowBranchRows = EXPIVOTLib.ShowBranchRowsEnum.exBranchColumns
	.PivotRows = "0"
	.PivotBarVisible = EXPIVOTLib.PivotBarVisibleEnum.exPivotBarSingleAggregate Or EXPIVOTLib.PivotBarVisibleEnum.exPivotBarDefault
	.ShowDataOnDblClick = True
	.EndUpdate()
End With
|
|
174
|
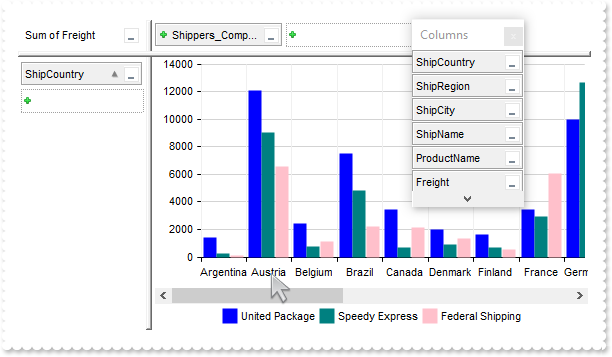
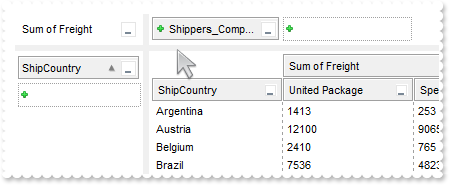
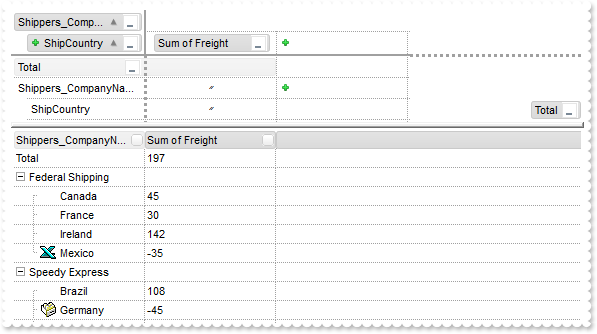
How can I provide a graphical/chart representation of my data
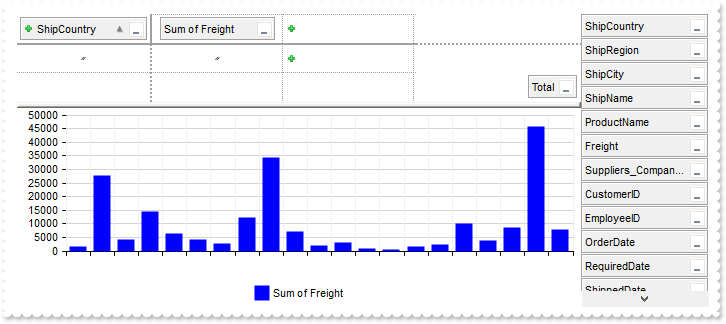
With AxPivot1
	.BeginUpdate()
	.HeaderHeight = 24
	.HeaderAppearance = EXPIVOTLib.AppearanceEnum.Etched
	.Import("C:\Program Files\Exontrol\ExPivot\Sample\data.txt")
	.PivotColumnsFloatBarVisible = EXPIVOTLib.PanelVisibleEnum.exPanelAsChild
	.PivotRows = "0"
	.PivotColumns = "sum(5)"
	.CustomView.ControlID = "exontrol.graph"
	.EndUpdate()
End With
|
|
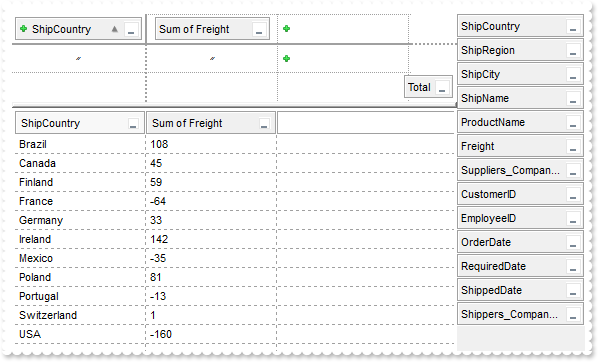
173
|
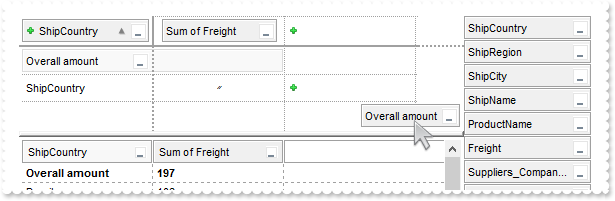
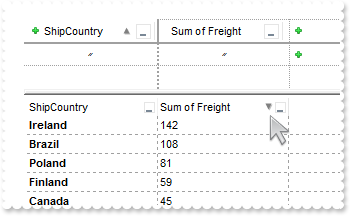
Rename the Total caption
With AxPivot1
	.BeginUpdate()
	.HeaderHeight = 24
	.HeaderAppearance = EXPIVOTLib.AppearanceEnum.Etched
	.Import("C:\Program Files\Exontrol\ExPivot\Sample\data.txt")
	.PivotRows = "0"
	.PivotColumns = "sum(5)"
	.PivotTotals = "/sum[bold]"
	.PivotColumnsFloatBarVisible = EXPIVOTLib.PanelVisibleEnum.exPanelAsChild
	.FormatPivotTotal = "( iaggregate = 5 ? (ilevel = 0 ? 'Overall amount' : 'Sectional sum') : caggregate )"
	.EndUpdate()
End With
|
|
172
|
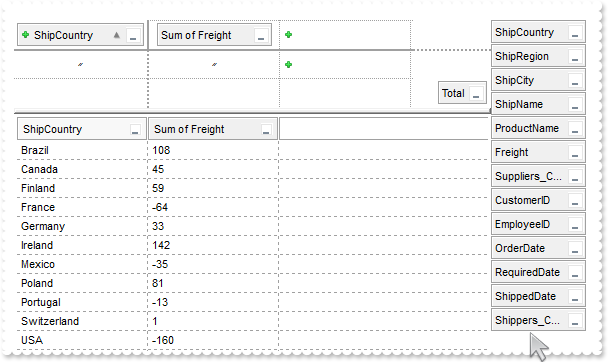
Specify the size of the Columns panel
With AxPivot1
	.BeginUpdate()
	.HeaderHeight = 24
	.HeaderAppearance = EXPIVOTLib.AppearanceEnum.Etched
	.Import("C:\Program Files\Exontrol\ExPivot\Sample\data.txt")
	.PivotRows = "0"
	.PivotColumns = "sum(5)"
	.PivotColumnsFloatBarRect = ",,96"
	.PivotColumnsFloatBarVisible = EXPIVOTLib.PanelVisibleEnum.exPanelAsChild
	.EndUpdate()
End With
|
|
171
|
Show a vertical line between pivot and Columns panel (EBN color)
With AxPivot1
	.BeginUpdate()
	.VisualAppearance.Add(1,"gBFLBCJwBAEHhEJAAEhABRsIQAAYAQGKIYBkAKBQAGaAoDDUNQxQwAAxwfBMKgBBCLIxhEYobgmGIXRpFICQTIcBhaGIZRiAKCRTDmHwyRCNIwCLD8QxtDqBY4gOZZX" & _
	"hal4cJTgMaBYi+Pw3DZHcbvBRkewzHQAKgnSjoDhEMg1CTVVYTDKdOSzDyEX7sIAACpOIZQVJVEY1VT8cyxIyEZimSypWqiYJ0Ty6cQwTAIgI")
	.set_Background(EXPIVOTLib.BackgroundPartEnum.exColumnsFloatBackColor,16777216)
	.HeaderHeight = 24
	.HeaderAppearance = EXPIVOTLib.AppearanceEnum.Etched
	.Import("C:\Program Files\Exontrol\ExPivot\Sample\data.txt")
	.PivotRows = "0"
	.PivotColumns = "sum(5)"
	.PivotColumnsFloatBarVisible = EXPIVOTLib.PanelVisibleEnum.exPanelAsChild
	.EndUpdate()
End With
|
|
170
|
Change the background of the Columns panel (EBN color)
With AxPivot1
	.BeginUpdate()
	.VisualAppearance.Add(1,"gBFLBCJwBAEHhEJAAEhABNoCg6AADACAxRDAMgBQKAAzQFAYahqGKGAAGOD4JhUAIIRZGMIjFDcEwxC6NIpAWLoJDCH4mSTHYxgJIMWwzDiBZgkCA4fiGEYnThCIxzT" & _
	"J0aw1CKbYRAKCUKoUAJFsSnQAJIgOO4lULPMIhDDQKQTIKBahoehqIhaEQyDSJNb2DCIahhMSEbKtCooDhGFZUWzLVxTJJNawHJqJJDuOTpSjKH4+RjWFKUXR9b4BJSN" & _
	"AgqeCQTiSWZEVxRUS0XbGCyZLSQY7uAAMKgOVoDYzdGLwHTtOwrMa1QAsDSbKqWZ5uRpHcQ5aAGN5DPbMbqwOaqLznAaLQLtG4RTikVRPTDYaj437+OaHGyNbI6HTNPp" & _
	"TlWDJWjYXI8l8C4fg6GYAAEEISgGJJGHQOocgyIwYnqKhYAAIQTH2MYRjQJBRAmZptmEAYIjGU5dk8UgOFgBJUgCTQIBYBoBmCCAmAqApghgDJUDmYQFCCZoEk2OBUm+" & _
	"BZPCgZgagaYZIHYHoHmGWBcm8NwiEiFJVgmYgji4Kg6GKSI2C6C5jAiRgygwIojiycINkyeJmAYPJjkiTg+g+ZAIkCdIQkyWQWDuDxkBkJhKguZAzlIRQzGQc5ODWFJl" & _
	"EkVhWhWZYJFYTYTmUE4yF6F5mAmBhihiZhJhYX4WmQaAUnWGpOlmNhuhuZwJkYcocmcSY4naHZlkmKhrDuJ5JnYfofmgCgGgKIJnlmXJ2h4TQKBosRokoNoOiOaQKDSd" & _
	"4kmiChMncPBpgoZoaiaaZKHaHonmmE5iiKJRpDicomimaoKiaKoqmqSoeiIPgogqPotiyaxKlYPA+GuCqbBMa5KnaPovmwCwGj6LgP24RIhiyCwmkqMpsksNpKD6LQLB" & _
	"qOIzi0SxWlaHZtAOahPssM5Wi+IYtlsXpijKbZ5lyTo5mAE4UlqOpjHOQpEjubyanKPJvEuNgVj2TY1CCao+k2G52AyP5wAwBp9DYZZ1CCaxsAABAEICA")
	.set_Background(EXPIVOTLib.BackgroundPartEnum.exColumnsFloatBackColor,16777216)
	.HeaderHeight = 24
	.HeaderAppearance = EXPIVOTLib.AppearanceEnum.Etched
	.Import("C:\Program Files\Exontrol\ExPivot\Sample\data.txt")
	.PivotRows = "0"
	.PivotColumns = "sum(5)"
	.PivotColumnsFloatBarVisible = EXPIVOTLib.PanelVisibleEnum.exPanelAsChild
	.EndUpdate()
End With
|
|
169
|
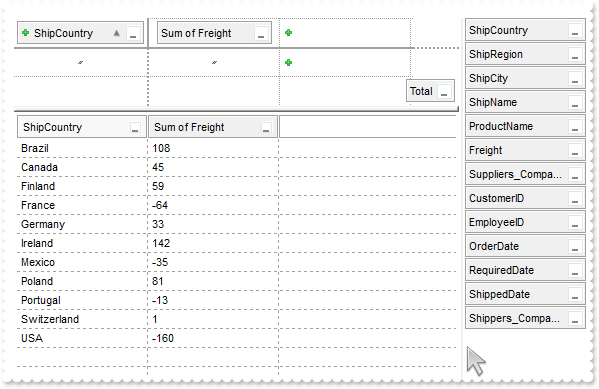
Change the background of the Columns panel (solid color)
With AxPivot1
	.BeginUpdate()
	.HeaderHeight = 24
	.HeaderAppearance = EXPIVOTLib.AppearanceEnum.Etched
	.Import("C:\Program Files\Exontrol\ExPivot\Sample\data.txt")
	.PivotRows = "0"
	.PivotColumns = "sum(5)"
	.PivotColumnsFloatBarVisible = EXPIVOTLib.PanelVisibleEnum.exPanelAsChild
	.set_Background(EXPIVOTLib.BackgroundPartEnum.exColumnsFloatBackColor,15790320)
	.EndUpdate()
End With
|
|
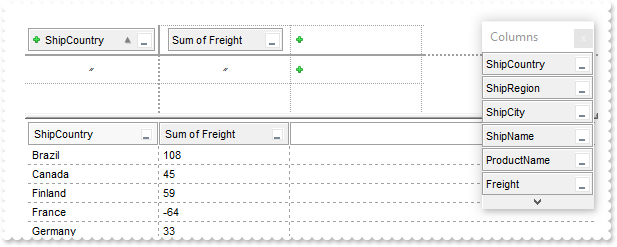
168
|
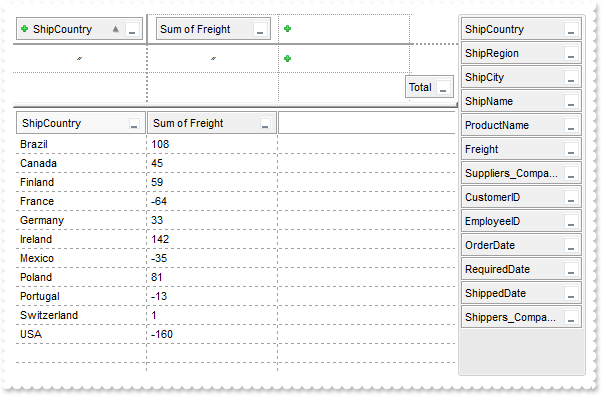
Change the visual appearance of the Columns panel
With AxPivot1
	.BeginUpdate()
	.VisualAppearance.Add(1,"gBFLBCJwBAEHhEJAAEhABNoCg6AADACAxRDAMgBQKAAzQFAYahqGKGAAGOD4JhUAIIRZGMIjFDcEwxC6NIpAWLoJDCH4mSTHYxgJIMWwzDiBZgkCA4fiGEYnThCIxzT" & _
	"J0aw1CKbYRAKCUKoUAJFsSnQAJIgOO4lULPMIhDDQKQTIKBahoehqIhaEQyDSJNb2DCIahhMSEbKtCooDhGFZUWzLVxTJJNawHJqJJDuOTpSjKH4+RjWFKUXR9b4BJSN" & _
	"AgqeCQTiSWZEVxRUS0XbGCyZLSQY7uAAMKgOVoDYzdGLwHTtOwrMa1QAsDSbKqWZ5uRpHcQ5aAGN5DPbMbqwOaqLznAaLQLtG4RTikVRPTDYaj437+OaHGyNbI6HTNPp" & _
	"TlWDJWjYXI8l8C4fg6GYAAEEISgGJJGHQOocgyIwYnqKhYAAIQTH2MYRjQJBRAmZptmEAYIjGU5dk8UgOFgBJUgCTQIBYBoBmCCAmAqApghgDJUDmYQFCCZoEk2OBUm+" & _
	"BZPCgZgagaYZIHYHoHmGWBcm8NwiEiFJVgmYgji4Kg6GKSI2C6C5jAiRgygwIojiycINkyeJmAYPJjkiTg+g+ZAIkCdIQkyWQWDuDxkBkJhKguZAzlIRQzGQc5ODWFJl" & _
	"EkVhWhWZYJFYTYTmUE4yF6F5mAmBhihiZhJhYX4WmQaAUnWGpOlmNhuhuZwJkYcocmcSY4naHZlkmKhrDuJ5JnYfofmgCgGgKIJnlmXJ2h4TQKBosRokoNoOiOaQKDSd" & _
	"4kmiChMncPBpgoZoaiaaZKHaHonmmE5iiKJRpDicomimaoKiaKoqmqSoeiIPgogqPotiyaxKlYPA+GuCqbBMa5KnaPovmwCwGj6LgP24RIhiyCwmkqMpsksNpKD6LQLB" & _
	"qOIzi0SxWlaHZtAOahPssM5Wi+IYtlsXpijKbZ5lyTo5mAE4UlqOpjHOQpEjubyanKPJvEuNgVj2TY1CCao+k2G52AyP5wAwBp9DYZZ1CCaxsAABAEICA")
	.set_Background(EXPIVOTLib.BackgroundPartEnum.exColumnsFloatAppearance,16777216)
	.set_Background(EXPIVOTLib.BackgroundPartEnum.exColumnsFloatCaptionBackColor,16185078)
	.GetOcx().BackColorHeader = &H1000000
	.HeaderHeight = 24
	.HeaderAppearance = EXPIVOTLib.AppearanceEnum.Etched
	.Import("C:\Program Files\Exontrol\ExPivot\Sample\data.txt")
	.PivotRows = "0"
	.PivotColumns = "sum(5)"
	.PivotColumnsFloatBarVisible = EXPIVOTLib.PanelVisibleEnum.exPanelVisible
	.EndUpdate()
End With
|
|
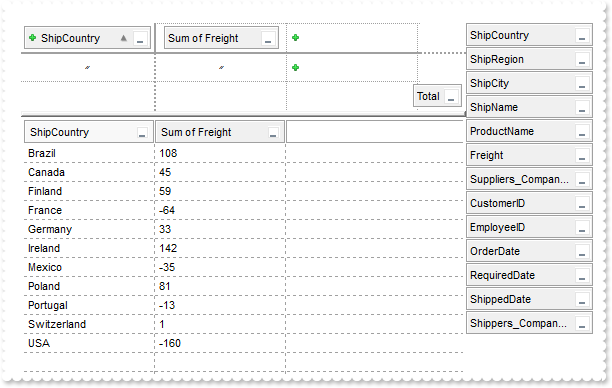
167
|
Display the columns that users can group by or use for aggregate functions (child)
With AxPivot1
	.BeginUpdate()
	.HeaderHeight = 24
	.HeaderAppearance = EXPIVOTLib.AppearanceEnum.Etched
	.Import("C:\Program Files\Exontrol\ExPivot\Sample\data.txt")
	.PivotRows = "0"
	.PivotColumns = "sum(5)"
	.PivotColumnsFloatBarVisible = EXPIVOTLib.PanelVisibleEnum.exPanelAsChild
	.EndUpdate()
End With
|
|
166
|
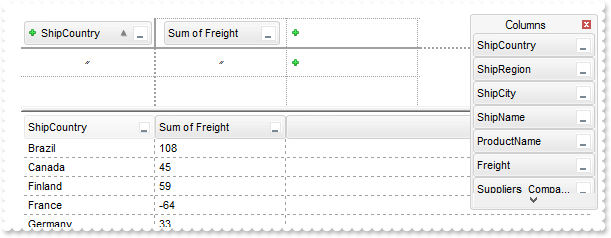
Display the columns that users can group by or use for aggregate functions (float)
With AxPivot1
	.BeginUpdate()
	.HeaderHeight = 24
	.HeaderAppearance = EXPIVOTLib.AppearanceEnum.Etched
	.Import("C:\Program Files\Exontrol\ExPivot\Sample\data.txt")
	.PivotRows = "0"
	.PivotColumns = "sum(5)"
	.PivotColumnsFloatBarVisible = EXPIVOTLib.PanelVisibleEnum.exPanelVisible
	.EndUpdate()
End With
|
|
165
|
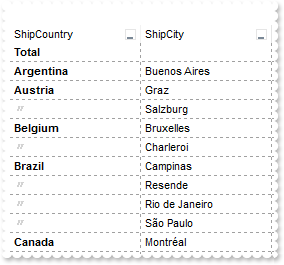
ShowIdem {string}, specifies the symbol used to indicate repeated captions, offering a clear visual cue for identical entries. This property is effective only when the showBranchRows property is set to exBranchColumns mode
With AxPivot1
	.BeginUpdate()
	.Import("C:\Program Files\Exontrol\ExPivot\Sample\data.txt")
	.PivotRows = "0[bold],2"
	.PivotColumns = "sum(5)[content=currency],sum(5)[content=currency]/12:A"
	.PivotTotals = "/sum[bold,content=currency]"
	.ShowBranchRows = EXPIVOTLib.ShowBranchRowsEnum.exBranchColumns
	.ShowIdem = "<fgcolor lightgray>〃"
	.EndUpdate()
End With
|
|
164
|
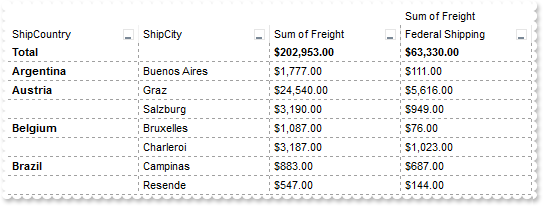
exBranchColumns + exBranchIncludeAggregate + exBranchRowDivider
With AxPivot1
	.BeginUpdate()
	.Import("C:\Program Files\Exontrol\ExPivot\Sample\data.txt")
	.PivotRows = "0[bold],2"
	.PivotColumns = "sum(5)[content=currency],sum(5)[content=currency]/12:A"
	.PivotTotals = "/sum[bold,content=currency]"
	.ShowBranchRows = EXPIVOTLib.ShowBranchRowsEnum.exBranchIncludeAggregate Or EXPIVOTLib.ShowBranchRowsEnum.exBranchRowDivider Or EXPIVOTLib.ShowBranchRowsEnum.exBranchColumns
	.EndUpdate()
End With
|
|
163
|
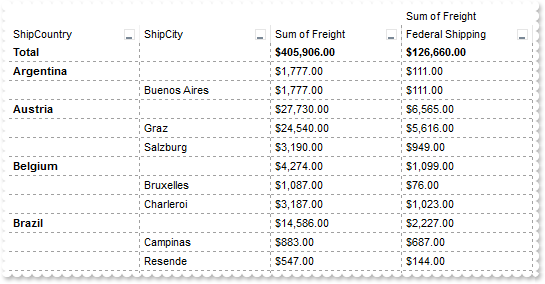
exBranchColumns + exBranchIncludeAggregate
With AxPivot1
	.BeginUpdate()
	.Import("C:\Program Files\Exontrol\ExPivot\Sample\data.txt")
	.PivotRows = "0[bold],2"
	.PivotColumns = "sum(5)[content=currency],sum(5)[content=currency]/12:A"
	.PivotTotals = "/sum[bold,content=currency]"
	.ShowBranchRows = EXPIVOTLib.ShowBranchRowsEnum.exBranchIncludeAggregate Or EXPIVOTLib.ShowBranchRowsEnum.exBranchColumns
	.EndUpdate()
End With
|
|
162
|
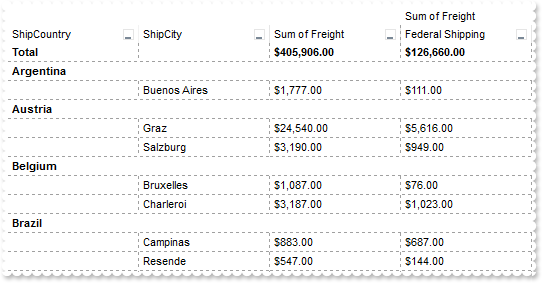
exBranchColumns
With AxPivot1
	.BeginUpdate()
	.Import("C:\Program Files\Exontrol\ExPivot\Sample\data.txt")
	.PivotRows = "0[bold],2"
	.PivotColumns = "sum(5)[content=currency],sum(5)[content=currency]/12:A"
	.PivotTotals = "/sum[bold,content=currency]"
	.ShowBranchRows = EXPIVOTLib.ShowBranchRowsEnum.exBranchColumns
	.EndUpdate()
End With
|
|
161
|
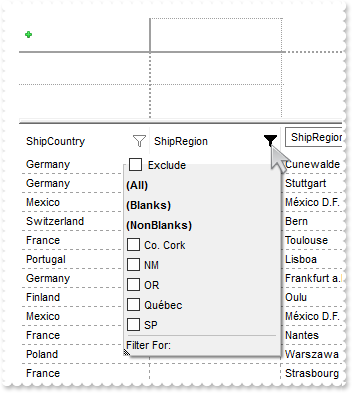
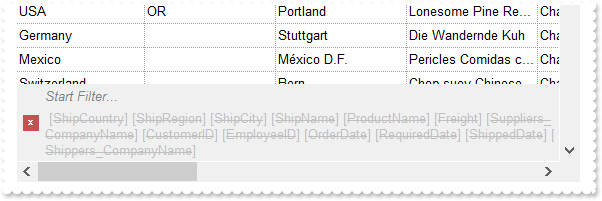
Displays a glitch funnel for drop-down filter buttons (empty or active)
With AxPivot1
	.BeginUpdate()
	With .VisualAppearance
		.RenderType = -1
		.Add(1,"gBFLBCJwBAEHhEJAAEhABa8IQAAYAQGKIYBkAKBQAGaAoDDUNQxQwAAxwfBMKgBBCLIxhEYobgmGIXRpFMbxCKQahLEiTIhGUYJHgmK4tRiAUgxVDkBxrECZYqjcBZO" & _
	"iwLQ2TxDM7DNKUCBnIoABhGOaYDh+IQNQjUFKwTRFGRxK4EIRKAyTDLQdRyGSMMbjdQpBCbMiMRqhESKRq2UwYRYCFS1NalaztO6BUAvK67YrWez/YBfF+SfwGeqDYRe" & _
	"WAPfgWERnQrGMLxbD8KwZAKTRjkGJ4XhuB41TbQMqufL9ByXHKSSDpGjaXjeO5VVjYNAvS69UzXNq3bhtQAOXCMEwCgI=")
		.Add(2,"CP:1 -2 0 0 0")
	End With
	.HeaderHeight = 28
	.set_Background(EXPIVOTLib.BackgroundPartEnum.exHeaderFilterBarButton,33554432)
	.set_Background(EXPIVOTLib.BackgroundPartEnum.exHeaderFilterBarActive,33554433)
	.set_Background(EXPIVOTLib.BackgroundPartEnum.exCursorHoverColumn,-1)
	.Import("C:\Program Files\Exontrol\ExPivot\Sample\data.txt")
	.FilterBarFont = .Font
	.set_Description(EXPIVOTLib.DescriptionTypeEnum.exFilterBarAnd,.FormatABC("`<fgcolor=808080> ` + value + ` </fgcolor>`",.get_Description(EXPIVOTLib.DescriptionTypeEnum.exFilterBarAnd)))
	.FilterBarCaption = "(( ( value replace `[<b>` with `<bgcolor=000000><fgcolor=FFFFFF><b> ` replace `</b>]` with ` </b></bgcolor></fgcolor>` replace " & _
	"`[<s>` with `<bgcolor=C0C0C0><fgcolor=FFFFFF> ` replace `</s>]` with ` </fgcolor></bgcolor>` )  + `<r><fgcolor=808080>` + ( matc" & _
	"hitemcount < 0 ? ( ( len(value) ? `` : `` ) + `<r>` + abs(matchitemcount + 1) + ` result(s)` ) : (`<r><fgcolor=808080>`+ itemcou" & _
	"nt + ` item(s)`) )))"
	.FilterBarPromptVisible = EXPIVOTLib.FilterBarVisibleEnum.exFilterBarCompact Or EXPIVOTLib.FilterBarVisibleEnum.exFilterBarShowCloseIfRequired Or EXPIVOTLib.FilterBarVisibleEnum.exFilterBarSingleLine Or EXPIVOTLib.FilterBarVisibleEnum.exFilterBarCaptionVisible Or EXPIVOTLib.FilterBarVisibleEnum.exFilterBarVisible Or EXPIVOTLib.FilterBarVisibleEnum.exFilterBarPromptVisible
	.EndUpdate()
End With
|
|
160
|
Can I use a control to generate the data and another to import data (sample 2)
Dim d
With AxPivot1
	With CreateObject("Exontrol.Pivot")
		.Import("C:\Program Files\Exontrol\ExPivot\Sample\data.txt")
		.PivotRows = "0"
		.PivotColumns = "sum(5)[caption=<fgcolor red><b>Total]"
		d = .Export()
	End With
	.Import(d)
End With
|
|
159
|
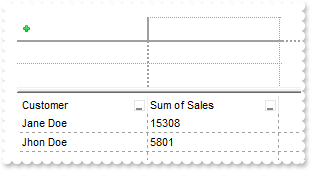
Can I use a control to generate the data and another to import data (sample 1)
Dim d,rs
With AxPivot1
	With CreateObject("Exontrol.Pivot")
		rs = CreateObject("ADODB.Recordset")
		With rs
			With .Fields
				.Append("Code",8)
				.Append("Customer",8)
				.Append("Sales",5)
			End With
			.Open()
			.AddNew()
			.Fields.Item("Code").Value = "M"
			.Fields.Item("Customer").Value = "Jhon Doe"
			.Fields.Item("Sales").Value = 1234
			.Update()
			.AddNew()
			.Fields.Item("Code").Value = "M"
			.Fields.Item("Customer").Value = "Jhon Doe"
			.Fields.Item("Sales").Value = 4567
			.Update()
			.AddNew()
			.Fields.Item("Code").Value = "F"
			.Fields.Item("Customer").Value = "Jane Doe"
			.Fields.Item("Sales").Value = 9876
			.Update()
			.AddNew()
			.Fields.Item("Code").Value = "F"
			.Fields.Item("Customer").Value = "Jane Doe"
			.Fields.Item("Sales").Value = 5432
			.Update()
		End With
		.DataSource = rs
		.PivotRows = "1"
		.PivotColumns = "sum(2)"
		d = .Export()
	End With
	.Import(d)
End With
|
|
158
|
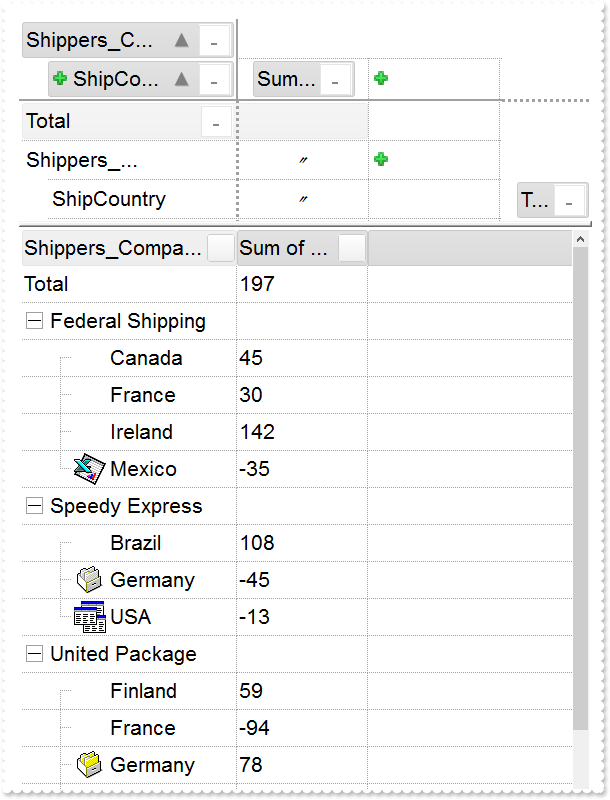
How can I replace or add an icon at runtime
With AxPivot1
	.BeginUpdate()
	.ImageSize = 16
	.ReplaceIcon("gAAAABgYACEHgUJFEEAAWhUJCEJEEJggEhMCYEXjUbjkJQECj8gj8hAEjkshYEpk8kf8ClsulsvAExmcvf83js5nU7nkCeEcn8boMaocXosCB9Hn09pkzcEuoL/fE+O" & _
	"kYB0gB9YhIHrddgVcr9aktZADAD8+P8CgIA==")
	.ReplaceIcon("C:\images\favicon.ico",0)
	With .VisualAppearance
		.Add(4,"gBFLBCJwBAEHhEJAAEhABUYCg6AADACAxRDgMQBQKAAzQFAYbhkGCGAAGMZxRgmFgAQhFcZQSKUOQTDKMIziYBYfgkMIgSbJUgDGAkRRdDSOYDmGQYDiCIoRShOMIjH" & _
	"LUXxtDaIZwhEAoJb+RgAUY/cTzaAEUwHHiTKInaCQShsFYJUJAdRURQ9EwvCIZBpEWwLChENQwWLCNj2TScBwjCyqbale45ViqdoDU5EUiXJJ8ZxnECfYyrGjaMpCeKB" & _
	"UrGYTVRBIMxLLSia5oeJqMrnBpNVrIUgXCAGFwHK6BcauXIIDp6XoWWRbAAWDpVVzNNC3YzkCIceADHKiXxmVz4JLdGZ1QTGID2XaYaxWK4oZjsVSc4KDHbETbHFi9Fo" & _
	"3NaaxGisew+GYc4HlCR5NAAAIIEkQJSGMOgdE4RhYDwJJsAaAYQgmPpolCWgSCiBJzjcEIAkQXIBm8d5UhOQgCDUIBDDJDhgggJgKgKYJIDSVoDk8KBFF4OohEMZgWDs" & _
	"YYDj4GoGmGSB2B6B5iAiBgYDsYRjGSbIJo4RgqDuIpIAoLoLmMCJGDKDJjJiLA7xqUAAgGTwYnYPoPmQCQGEKEJkEkFg9gGY44BoRoSmSSQ2EKEggHgRhShSZRJFYVoV" & _
	"mWCRmFKFAgGOTheheZgJgYYoYmYSYWGaF4lkMMJ0hqZpJjYbobmcCZGHKHJmjmJh0h2Z4JmYcIaE8WZ2H6H5oAoBoCiCaBKBYfdjGoJoKiKaJKDaDojmkChGgmIgpCoV" & _
	"oWiWaJZiSd4mmmSh2h6J5qAqBoiiiaY5iSeIpmqComiqKpqkqNouiuah6hqMIsmsSpWiuGhP1kOoumuSp2j6L5sAsBo54gKwWkaMZsgsJpKjKbJLDaRYxYWRpSjSbIZi" & _
	"Se41m2CxmlqNptksdpejebR5iSfI4m4S4W16boLiaao6m5fJ9jubwLkaco8m8S5WnaPZunuOp4j6b5Lnac4SA0PAGlgP4wEwFwGkGcIMCcCpCnCCxiA8NYAAmMJfkSbh" & _
	"FCcFpFnGDBnBqRpUhuEwTDeZ5lHCfw6HIQxLCaAxygyJwqgGcATE4FA6hWY4tjEAAQBAgIA==")
	End With
	.GetOcx().BackColorHeader = &H4c6c6c6
	.GetOcx().SelBackColor = &H4000000
	.SelForeColor = RGB(0,0,1)
	.set_Background(EXPIVOTLib.BackgroundPartEnum.exSelBackColorFilter,.SelBackColor)
	.set_Background(EXPIVOTLib.BackgroundPartEnum.exSelForeColorFilter,.SelForeColor)
	.set_Background(EXPIVOTLib.BackgroundPartEnum.exBackColorFilter,.BackColor)
	.set_Background(EXPIVOTLib.BackgroundPartEnum.exForeColorFilter,.ForeColor)
	.set_Background(EXPIVOTLib.BackgroundPartEnum.exCursorHoverColumn,-1)
	.set_Background(EXPIVOTLib.BackgroundPartEnum.exHeaderFilterBarButton,67108864)
	.set_Background(EXPIVOTLib.BackgroundPartEnum.exHeaderFilterBarActive,67174657)
	.set_Background(EXPIVOTLib.BackgroundPartEnum.exFooterFilterBarButton,67109119)
	.HeaderAppearance = EXPIVOTLib.AppearanceEnum.Etched
	.GridLineStyle = EXPIVOTLib.GridLinesStyleEnum.exGridLinesGeometric
	.Import("C:\Program Files\Exontrol\ExPivot\Sample\data.txt")
	.PivotRows = "12,0"
	.PivotColumns = "sum(5)"
	.PivotTotals = "/sum"
	.DataColumns.item(0).FormatImage = "1"
	.EndUpdate()
End With
|
|
157
|
Rename the caption of a generated column
With AxPivot1
	.BeginUpdate()
	.HeaderAppearance = EXPIVOTLib.AppearanceEnum.Etched
	.HeaderHeight = 24
	.Import("C:\Program Files\Exontrol\ExPivot\Sample\data.txt")
	.PivotRows = "0"
	.PivotColumns = "sum(5)[caption=<fgcolor red><b>Total]"
	.EndUpdate()
End With
|
|
156
|
Computed-columns support
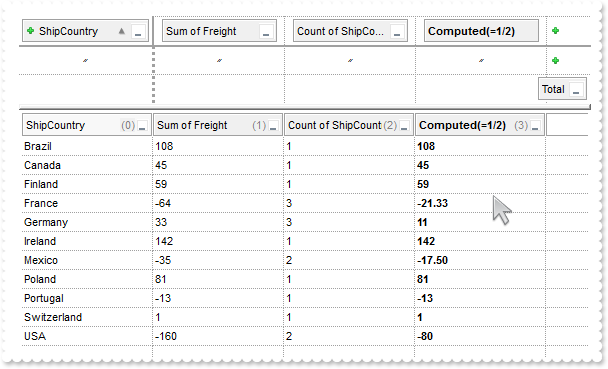
With AxPivot1
	.BeginUpdate()
	.HeaderAppearance = EXPIVOTLib.AppearanceEnum.Etched
	.HeaderHeight = 24
	.GridLineStyle = EXPIVOTLib.GridLinesStyleEnum.exGridLinesGeometric
	.Import("C:\Program Files\Exontrol\ExPivot\Sample\data.txt")
	.set_Background(EXPIVOTLib.BackgroundPartEnum.exColumnIndexColor,8421504)
	.FormatContents.Add("Cptd","(%1/%2) format `` replace `.00` with ``").Visible = False
	.PivotRows = "0"
	.PivotColumns = "sum(5),count(0),count(0)[content=Cptd,caption=<b>Computed(=1/2),bold]"
	.EndUpdate()
End With
|
|
155
|
Show the index of each (generated-)column
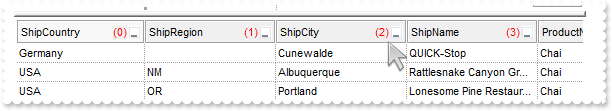
With AxPivot1
	.BeginUpdate()
	.HeaderAppearance = EXPIVOTLib.AppearanceEnum.Etched
	.HeaderHeight = 24
	.GridLineStyle = EXPIVOTLib.GridLinesStyleEnum.exGridLinesGeometric
	.Import("C:\Program Files\Exontrol\ExPivot\Sample\data.txt")
	.set_Background(EXPIVOTLib.BackgroundPartEnum.exColumnIndexColor,255)
	.EndUpdate()
End With
|
|
154
|
The fine dotted lines in the control appear much thicker than the standard ones we've been using. How can we fix this
With AxPivot1
	.BeginUpdate()
	.GridLineStyle = EXPIVOTLib.GridLinesStyleEnum.exGridLinesGeometric
	.Import("C:\Program Files\Exontrol\ExPivot\Sample\data.txt")
	.EndUpdate()
End With
|
|
153
|
Are there any properties to set text margins at tooltip, like Margins="5,5" (method 1). Margins is used to get some space between text and the tooltips border
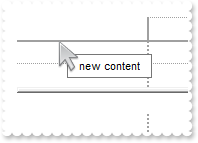
' MouseMove event - Occurs when the user moves the mouse.
Private Sub AxPivot1_MouseMoveEvent(ByVal sender As System.Object, ByVal e As AxEXPIVOTLib._IPivotEvents_MouseMoveEvent) Handles AxPivot1.MouseMoveEvent
	With AxPivot1
		.ShowToolTip("new content","",Nothing,"+8","+8")
	End With
End Sub

With AxPivot1
	.ToolTipMargin = "16,8"
End With
|
|
152
|
How can i set the sort order of an aggregated column with code
With AxPivot1
	.Import("C:\Program Files\Exontrol\ExPivot\Sample\data.txt")
	.PivotRows = "0[bold]"
	.PivotColumns = "sum(5)"
	.DataColumns.item("Freight").SortType = EXPIVOTLib.SortTypeEnum.SortNumeric
	.Layout = "singlesort=""C1:2"""
End With
|
|
151
|
Force hover-all feature
With AxPivot1
	.set_Background(EXPIVOTLib.BackgroundPartEnum.exScrollHoverAll,-1)
	.Import("C:\Program Files\Exontrol\ExPivot\Sample\data.txt")
End With
|
|
150
|
Disable hover-all feature (Windows 11 or greater)
With AxPivot1
	.set_Background(EXPIVOTLib.BackgroundPartEnum.exScrollHoverAll,1)
	.Import("C:\Program Files\Exontrol\ExPivot\Sample\data.txt")
End With
|
|
149
|
Display a custom tooltip
' MouseMove event - Occurs when the user moves the mouse.
Private Sub AxPivot1_MouseMoveEvent(ByVal sender As System.Object, ByVal e As AxEXPIVOTLib._IPivotEvents_MouseMoveEvent) Handles AxPivot1.MouseMoveEvent
	With AxPivot1
		.ShowToolTip("new content","",Nothing,"+8","+8")
	End With
End Sub

With AxPivot1
	.Import("C:\Program Files\Exontrol\ExPivot\Sample\data.txt")
End With
|
|
148
|
Shows the tooltip of the object moved relative to its default position
' MouseMove event - Occurs when the user moves the mouse.
Private Sub AxPivot1_MouseMoveEvent(ByVal sender As System.Object, ByVal e As AxEXPIVOTLib._IPivotEvents_MouseMoveEvent) Handles AxPivot1.MouseMoveEvent
	With AxPivot1
		.ShowToolTip("<null>","<null>",Nothing,"+8","+8")
	End With
End Sub

With AxPivot1
	.Import("C:\Program Files\Exontrol\ExPivot\Sample\data.txt")
End With
|
|
147
|
ADOR, MDB (JET)
Dim rs
With AxPivot1
	rs = CreateObject("ADOR.Recordset")
	With rs
		.Open("Data","Provider=Microsoft.Jet.OLEDB.4.0;Data Source=C:\Program Files\Exontrol\ExPivot\Sample\Access\sample.mdb",3,3)
	End With
	.DataSource = rs
End With
|
|
146
|
ImageSize property on 32 (specifies the size of control' icons/images/check-boxes/radio-buttons)
With AxPivot1
	.BeginUpdate()
	.ImageSize = 32
	.DefaultItemHeight = 36
	.HeaderHeight = .DefaultItemHeight
	.Font.Size = 16
	.FilterBarFont.Size = AxPivot1.Font.Size
	.ToolTipFont.Size = AxPivot1.Font.Size
	.Indent = 26
	.Images("gBJJgBAIDAAEg4AEEKAD/hz/EMNh8TIRNGwAjEZAEXjAojKAjMLjABhkaABAk0plUrlktl0vmExmUzmk1m03nE5nU7nk9miAoE+oVDolFo1HpFJpU5h8Sf9OqFNqUOq" & _
	"NUqdPq9VrFWrlbr1QpdhAFAkFis1ntFptVrtkrpszrNvmVxqk3uVtm1kmF3sdBvF/wGBmV+j9BYGHwWJulfxdax2NyFdx2JlV6l9Nw7AAGZymdz2Cy2GxErvWcz9ivlw" & _
	"yV21cuxugwktzGIzmvwtl0+53U5y0a0Wazmmyu/3dCyOMyXHx/J5nIr9q3uyqnBxFN3G46ma4vb7mD2Ng4nZze00fDkHC7t7us2rOX5tguetpHRlmz4HVqnXk1PjHO+C" & _
	"MPo9MBMC+j2vC8j7wS8cFNI4kBo05UIvfCT/NsnsApU+0Fqg/T+oy/kPxC0sEQfErKQK96+w28UWRI8UGvO8sTLS9r2PWmsMJTDTask3CsIbIEQRA3shOXEEAO/GclJ9" & _
	"FEKrrA8FRbKMXRIlb0JxCkjS1LMswhCcvuel0cv26cSMa8Ufx+2sQwhEUoSXOCjSbLcnxjKc7sdKUVyq28NtVI71P9P7JxtQEapjQ6fzfM8zPfNE2PhIsLL63E40slk5" & _
	"y7N89LcyU9SvMb3SdUc6VJLj5VLVLfO/PS9KzNFHUa/0XyBD0dxlS9cxhMlTRSoNXypPErWDPyfNS+MwprRNO0FD8wVVZ1AI08URwVRjtJ1WCn21QkkUrXVLVPQS/XIk" & _
	"FgTxT9iONZ9xVTdq+L1eKg3kkF6Upe68XtfV51/MtrVjBlwYFL1ev8y1/P6/lyzzYl02wntj0RVFmS1Qa+M5as93QxEUW9e993rfmQ2+vy65M/mL1lhl/2bj2ByVduMt" & _
	"NhCJT9hdz41nN14Ld12Z9UjfI/oUAaGseiw6+uFLLhcVabJOS5RqOE0BHlZ5VnEr5fOMs3st+aa/bbRzrJGV51Y0b0DbqaWXZD90hIsPbjWu52+6Wyadpe66hhO+P/Xi" & _
	"oW5rD8ZbrUZuVg6n1dsE/cXmewu1m9PVwnd35/nueXho/NaJzmjc61W76esuT77eG8pTquy9TwWH8LEzG8RDfFalx3Gcfvna9rvG/cptGLd9tuI6TZOP5Fiqi99vea+X" & _
	"4VRcBq/JZZtVQ9cwSs5lsXE372+a9z7PbfB3VVqHyvMctLto8uob6eV0m/cD6MN2v+T33t6sBut42vdv2bJ8a997x2maFJfK+qArbGJPEKE+1qTflMsIdW/GCJX17KcT" & _
	"6/czr/X+u1g29B7j/4BQfWkkx4zIHisjhPCmE0K4SwtXM+d4BvHRwNZOoBph9IJvPek9d40FoMJxf691jj2ywQQcHEWET4XJwkTszlVqm2GokewxtBT1DpQjRxDN0rUV" & _
	"DNKdC3lb6tzNOwh6upMSSYfv4YBCl/bsn9PxiFCEo7SI6Obc9HeOrnY8x4jtHtdpN4GRbaorhsbu18Pph5CiHymI0RpSXGJ/z2oUOxYxG858AyiI+bfJtuTcG5yelBJy" & _
	"T8okhqFd4a5yxL0rvulYtKCsZiWxWkc1s1cRoxxwhA31DLE0mR9l9HqX8fJgTDmFMVH0MIsRzVYnwnMi1dyzmhLt2kS2pxIiU62Wj5ptQGlSYFakLonTUJNLKaM5Wzlf" & _
	"fEkuFkk5wTrhVO2eE7G6lJhxFFYUZ55zmn0WuBCD4pzhirFCKkbomsOoIYmZx5p90LoYWGPdD5g0QmJRKYxbZ6zYoVQ2jVGylSak7KSkFH6RSjpHKFuU+YMyNo5SulkC" & _
	"6I0vonTCitMXPoEpVS2H5FQfEqp2R1opIgAEkJISYARTCukOhmPNI5Ex/wzGHUsicMwA1LHgQ90Y/KpoQHAD+pB/R4NzIaMAB9Xaw1gqaAOsh/A/ptIkWUfhGK1kZH8R" & _
	"gH5GqvgArqRmt4AAPrTroRofBGADkqr6Rmu4D7CEaHARiwpJrEEZsXXwlVjyMWRsaRqwdkLGNBABZmytmyMnaINZqyVpLR2ftKAAAdd6h2osbaskdiq4EZtgSmyNcbVW" & _
	"RJNXe3AA7REar3b0stlAAXBtoRmvJGLjEYAHUWsFcwCD/rnaop9aEICMAPdK5hT6xpeuzdOtAgKuJeGfdq6ggEbkTvAP+p9UCHXrvKkcgIA==")
	With .VisualAppearance
		.Add(1,"gBFLBCJwBAEHhEJAAEhABfICg6AADACAxRDgMQBQKAAzQFAYbhkGCGAAGMZxRgmFgAQhFcZQSKUOQTDKMIziaQAGgkNQwCSLIwjNIsBxPFKVQChEYxSjKA40SJNUgyj" & _
	"6CCY+QLIE5PfQgAL9I6eJABCCSQKkYx0HScRiwPBIbAZAYhCZqaKhWgkKI/WBQIABRDVLx5ESiLRtKy7Mq2bpvXBcNxXHalaztO68LxvKyqHb5fJ/PpgL4YHgmC4NQ7E" & _
	"MRwF6rfbyfZ7Xg/ORPTijZ4sdzMHTzJyscx3HqfaBoOaZU5eMLceTUMofHIndxCcasPbsOatVqjG5sYjcGC3La9cz3Pq/bpuDCbMxuaK1TrYXr1TTrcofBDldAxXRKDx" & _
	"RDWVhLnYOw9i6XxzjuXprCaOoKB6EwbiCZZCGOdZYlcT4xHmbhMnwNxtn+G5bmqdZ7n4Pw/i+X5zm+dQ9g4CAFjsfAJheOI8HsDoWDWTB/lwSAQkmA5PEgRYoDyDwYFY" & _
	"FoFmGCBmBqBphDgRJ0gOTIYBGRB/lyRh0iSCZbjYWJzgWDwIjYLoLmMCJGDKDJjBgWgqG6YhyhGHRzA2aJ1mCABOAiOJvhCZBJBYRoRmSCQmEqEQimkAZgg8TZnDCV4U" & _
	"kmCUmBKZYJGYWoWCUUhiFMNZckNUh2GENoaGaGZmgmJhqhqZpGGIEx2GYIxSGGGJdggWJth2Z4JmYeoemeSZ2H6H4hGmQhihyTRHGYLg7CiCgmgqIpokoNoOiOaJ4jqA" & _
	"ochqaZGgaCxpAoZoaiaaJqEmWIcGgShcnCJwqEqFoR3YOoFlgchflqNouiuawHmWSYqGkWZQhcatzmaOoumuSp2j6L5bBaKo0GQKRnGGCxqiyCwmkqMpsksNpOGUGI7A" & _
	"0ew1G0Rxlg0PptgsZuDG2Sx2l6N5tnYNZZjUDRXDCVo5l2FoymqOpukuNpujubwLjmWY5k0ZwxkaFxYlWdp6j6b5Lnafo/nABQdg2FxcUsY5BkmXAkmeQpckwNRrkKTh" & _
	"8CSHZBk4NwyC4KxxgMDwakOMZDn8GgwnGAo2C4cwthMcwmCcMoHBMHRehwTIghySYNksZwcH4HBMEsHx5hyPItiweYxnwSZEH4Mozn0fR+DMAo7EYJ50gkdZelKdNql2" & _
	"UgJn0GIukwH4HicQRai2GI4mSVpNl0dZGledgNgcYpYDWUx3FsOQi5YV5anaTY3G6W53A2RxylydxFjiaxEFCCgBBAQ==")
		.Add(2,"gBFLBCJwBAEHhEJAAEhABcoFg6AADACAxRDgMQBQKAAzQFAYbhkGCGAAGMZxRgmFgAQhFcZQSKUOQTDKMIziaQAGgkNQwCSLIwjNIsBxPFKVQChEYxSjKA40SJNUgyj" & _
	"6CCY+QLIE5PfQgAL9I6eJABCCSQKkYx0HScRiwPBIbAZAYhCZqaKhWgkKI/WBQIABRDVLx5ESiLRtKy7Mq2bpvXBcNxXHalaztO68LxvKyqHb5fJ/PpgL4YHgmC4NQ7E" & _
	"MRwF6rfbyfZ7Xg/ORPTijZ4sdzMHTzJyscx3HqfaBoOaZU5eMLceTUMofHIndxCcasPbsLpOS5LNKsaxmWLYdhFdTxQi6LpvfA8BwXC6JY7heRYRbFbYxRjGNi1TS7G4" & _
	"nGKd5WGuL4UHwI4VkaYxii8V4pgQMgVBQdQ5iCTYGi8T4vlWbJ3nuPg+l+H5AlSCg6ByPBoE8Ap3jqYxhBido5g0OgOGOGI4CsSpCCAcgcAuEokiEN5NCKfJ9DyTRjnS" & _
	"cg1CEYxOBmBpPCgagdgcIZoHoGIFA4AxQkCAxKAgKBwgGSpIBCZhjF2E5UnQPQMiMCJBCIBwxkSQgsgo+JtDKT4ziiQw+k6EwAnsOgLnkHI+yCQ4iEuE4klkPhShEJBp" & _
	"AoPgymOMoaDgHBjFMBgyD0HYTiCZSZhIIIGC4ChiHSew5kwM5omILZPiOBI0hwZw5kodIdA+M4Uj4PxOmMSJ9DuTQzmyZgviceZagaHVfj4awwmaAh2GUIYmCOEZZDaD" & _
	"RDFGdwcg4EwyHMN4LBOaJbCoaZqgKH8qkMfIyD8DozDyfA7A0Coui0OpMmOZJdCsahKg6NooioChwmEMxLEoXJbDUTRXGSUgykyMgQG0GpPHMdI3D4TRCgSeQ0kmaw+l" & _
	"GNAtCOZJVCiT5DhyRQwAqMg0EoDBBGEGAsASC5yiSCw+k4Mp6lWNQuksTpRjMTxDGzJwGmGMpDDKXYTECSAxl6Q5olkK4PgMMIVkASRMBMBgzEkaZEjsNALhIZA6AeQB" & _
	"gk0ZJEgAAJ0CIAgODMNIsD6DRih9uYwFyAwfCUb5ijmbI+gwdxkk8MZMGeMpPCkDxzBiC5MHMPJLDSSROFMLIoBEQogEMFJPnENYQGgE4DCOaJfC7tYkhGTQ0kyWwyku" & _
	"XpMiyRpKjKR4wngM4JmOWJACCdYtHMWw+Eych4nINYLAEYA8AgdAEEsQZajaQoog4GxPiMVIolcdxNG8XZVkmNoRwWRVBlFeFEeAZQJgnFiHgHwcAhjhHgGMSI5xki2C" & _
	"yA4EQsA3i0HkBsLwKRFgAHcPkHopBJBcBeDUYI7xyDOHqKkWo2hLCsDIBIY4qQ5A8DoMMYwOAqCSBGKgU4yB2iDBwIgB4hxQgAAWNgBoAgsBdEcBUQ4sQ9A/HqD0JI8R" & _
	"pBzH2OYVgahLBHFiJQJweQiDhDUE4SAARQAzFsG0EQwA6AOWSBkFgVAIBCHeGERQFQiCQHeFkC4vkiB8DyB4F4QxVDvGMNEOQexMjlBeOAKQiQLgfDA7QEAaRiBdEkH8" & _
	"TI7AZiFBAGYBIABWjYBiGACioQ4C1A+AMMgWhfgxHgPsT4URIB0COKgPgjRwiAB8AYUArxBgCF6J4GY5hrAOCAPAAoGRRCsCIMEXATXfgAF8BMJwURuEQDgD4Q4OBoAe" & _
	"HGFgLIwQrC2D0JoSQ+QvhrHoSgQI8AbDFGID8C4Ah6BQAQAASACwgCYCMAUMARAvCKAiAMCAokeCKBEOAKgCBoDaHuMsEAqwJDiACDURg8R6gPCyDofYWAhgoDIJ4ZAu" & _
	"hoiGAYGgRoQw/A0GMMga4GwxiEDeIYYInATCDBQAoBAwAoDlA0KMBoVRGiDGwDQUYIRsgaGGDgM4LAwDWB8EcIA1APhjEgGQVwgRIgjFIIQHokgZA+CSEkLIKQSjHAwM" & _
	"sCwDAsAEB2ABTIwRwD6A8CMToSxkAxE4HYIw+BsgbBEDAHYBwojCBoIYFgXSjABE4MsHIbQWhlGILQS4UhvBdAUKEEwHgxDAAABQQQUAhgKHiDwE4JS4A7BGLQZwCR4g" & _
	"aBEMUYAqgKApHgGwVAIRNgvBMMQXImwZDtE4I8UIyAZCDCAE8AwrhgAdEEBACQLRCg4FEB4AYtA7CdEiPQMoJAMDNCkOMCAXAFDhH0D0Q4EgfAaGSK4NYzRUj9BuCgAg" & _
	"swOBjB4Fqpw8B2ADAwE4A4Qx2DAE6JIaQPQGhAGKBcIQ5B5gHByKIFARwADbAyKUfgdBKBBGyEcVIAB/ijHoIoSA0gdBNl+OATYERZgBGSDYWIWAUCEGKA4FAhR7CIBt" & _
	"YQGYZg4CMAiKEcAOwkBjHWE8Z4lQgA+DkBoTohwwCeAaMEEgBQCCABgHMRwQRhhMEWFQd4HwZgwDqFESItAbAGEANCpINAzANCCJkK4ah+heFYBURwsQrS2CsMYMoWGB" & _
	"hYDWI0EInQgiApXaOVI1QFDsC8MUNoMBMA1HMJga4eh+BeAWOgNNowGjYzCGAAwax+iJBeBVT4gxoBIAGFsJFBxgBiGKFkKQ7g5DFFQEcAo4AzDDACKEQQLgCiJDYB0M" & _
	"gRBCCQAgQEA==")
		.Add(3,"gBFLBCJwBAEHhEJAAEhABQ4Fg6AADACAxRDgMQBQKAAzQFAYbhkGCGAAGMZxRgmFgAQhFcZQSKUOQTDKMIziaQAGgkNQwCSLIwjNIsBxPFKVQChEYxSjKA40SJNUgyj" & _
	"6CCY+QLIE5PfQgAL9I6eJABCCSQKkYx0HScRiwPBIbAZAYhCZqaKhWgkKI/WBQIABRDVLx5ESiLRtKy7Mq2bpvXBcNxXHalaztO68LxvKyqHb5fJ/PpgL4YHgmC4NQ7E" & _
	"MRwF6rfbyfZ7Xg/ORPTijZ4sdzMHTzJyscx3HqfaBoOaZU5eMLceTUMofHIndxCcasPbsLpOS5LNKsaxmWLYdhFdTxQi6LpvfA8BwXC6JY7heRYRbFbYxRjGNi1TS7G4" & _
	"nGKd5WGuL4UHwI4VkaYxii8V4pgQMgVBQdQ5iCTYGi8T4vlWbJ3nuPg+l+H5AlSCg6ByPBoE8Ap3jqYxhBido5g0OgOGOGI4CsSpCCAcgcAuEosiYN5NHMOJ+D4TpTnS" & _
	"eQ7CEY4uBmBpPhgagdgcIZoHibIEyUBJZDQIJShoCgcCAcoyAQOYYlcZJ1D0DxDCiQgwEiAZMHEMJLFKPJ9D2DoDnidQ4k+Y5QmKEROBkIhKD0JIZDIS4TGUCQuEeEJj" & _
	"nOIg8CuY4RkYNgwGMM5RllGpThDRYIGKZIpCkJFUH0PINyWcQ3CaaZCG+HBnEOTJhD8Tx4GoeQ/GcaZSHOH5nCmQhshoZhihYYwhiYA4RlkNoNEMUZ3ByDjwEsPxOnMa" & _
	"J9DuDR6F6GYmCmKh0nANtMioP4Gg8aoSiIO5NhodociqaY6GaFYkEyOg8lsNRNTaUgykyMgQG0GpPiONJbD8DpDEyfA6k0KwOkWMQsGsAJU0SagwkoJQJDIPISCQCJTG" & _
	"SUwyGaM4KkmMgtksHpFjAZ4TGCBAbgaSpcksdhNAMIJHHsD5TjSWWMAMOpwjyLwbk6cAz0KRJiDkDYzESCwiggcgcgYIQwCIEINCMCITj6TVxkMXp2j0cQLlCTo7E2F4" & _
	"ymkMZdhMPJHDGHpLAyVg+k4UwrCCSIyByDJ8DuDY8CiWY0kiXAXC6QJwFKGIjCeJpjgyezjlyDw6klHx5myRoMGwZwbkcToTEiew4kwbQfEmUgPkOKJUD4DpTHSHQmgk" & _
	"XI/ASTA1g0XIEDMTBimyfI7jSLYHEiUoPk0Fw/kadAsHGao8A0A5smEMJ2mNyg5gzJZwDgCpChyIZVyIZwFCMJEPASRkBqE+IcHInRcDxA2H4bIsx0AtDsIBpwZwYicD" & _
	"6BscwDwUBgHCIYaIfgtiVH2O4WgUwJjEFeAEQA7y4hMCiBMS4aRdB9A4CYE4LxljyBMHcDItBxinDCLcTYmgejBFQ9UTg9gFBOEmAQTI7A4iZGMGkQAWQ7jYA2HIL8BR" & _
	"AjDG4HcCwARbjZHiNoDw1nLDnGyNINQ+wjCpBMEgcovQUgICQJEcgWRuBvAyJ4d4ugpCUAINcHogxIgnDiM4N4axzD3F2JMTY/hRqYF6FsWIxhYAGGoAALQYgYirBwBE" & _
	"BwpAjBEAAIEIYsA2gOHCMAGgXAACIDmMITAUgFABH0D0I4WwvhNFGMAOIvxRD2GKNcMA8gjAPDCPwBogRPAxA8PgRwZRICYDED8RAXQEghEAN8DIgwIBdB4JYWwMgtiQ" & _
	"HoFQKAiRFguFKGwGQhglDsEOVwEQQRkCKBwOIHgSREDRBYHEXQcQdD7GIGARQHRxipBrMobgewDCUCADsEYWAzgMHKHQDQxxsDzA6EMfAeQHB4GQDkUYPA0iECiKoGgR" & _
	"hcDdA2GMQA8AOCjDSPgHI4QnApAKBICwHg1A+BcAwcYsgbjGGQNkCIgRsA6EcBEWANADjsB0B8YYzQQDIGSBcEYZBCCPEkFIHQSgkgZAwG4IwBAbAYGGAgL4Ch4g8BOC" & _
	"QAA2KKC0GcAke4AAXAFCoHkDw4xbBFEcJkE4JRSiEFeJYKQVRMgJHODwX4xAgC/AsIIZAeAHDRG0HYI40RKCLEGDUI4jAghwBWIceA+whCpHMFYZYOQxglDMHMBQGxYj" & _
	"VHiAoBIPgfgHGwPsHYJRSB6A0IERQLhCjJHMA4OQoAoCOACLYGYSx8DpBQIMWQdRnDRH+DsE4fB3CeAmM67kAAXBFEIDYDI7wLBtEoEIfYNwjiUGGJQYQMAjCHEAO0C4" & _
	"zxW29CoCgfIxR9AKA6J8BgUAIhDGMIoJ40hqgwCgKETgnBhhqCGI0AIqgZhGDANQDIlBDCRGkCoJISR0g1BSKQOgfAzBRG0DYHARh4DeDAOwANuw8ApCKKkYg/RPhjBs" & _
	"H0J4yg5hPGWN0GwFBHQBFaDoQIURljFAoB4GgzRVzbBECQFQRQoguHGHANwDRdCKy8CgSIGwhhoDYJYYI1giBICSAEgI=")
		.Add(4,"gBFLBCJwBAEHhEJAAEhABUYCg6AADACAxRDgMQBQKAAzQFAYbhkGCGAAGMZxRgmFgAQhFcZQSKUOQTDKMIziYBYfgkMIgSbJUgDGAkRRdDSOYDmGQYDiCIoRShOMIjH" & _
	"LUXxtDaIZwhEAoJb+RgAUY/cTzaAEUwHHiTKInaCQShsFYJUJAdRURQ9EwvCIZBpEWwLChENQwWLCNj2TScBwjCyqbale45ViqdoDU5EUiXJJ8ZxnECfYyrGjaMpCeKB" & _
	"UrGYTVRBIMxLLSia5oeJqMrnBpNVrIUgXCAGFwHK6BcauXIIDp6XoWWRbAAWDpVVzNNC3YzkCIceADHKiXxmVz4JLdGZ1QTGID2XaYaxWK4oZjsVSc4KDHbETbHFi9Fo" & _
	"3NaaxGisew+GYc4HlCR5NAAAIIEkQJSGMOgdE4RhYDwJJsAaAYQgmPpolCWgSCiBJzjcEIAkQXIBm8d5UhOQgCDUIBDDJDhgggJgKgKYJIDSVoDk8KBFF4OohEMZgWDs" & _
	"YYDj4GoGmGSB2B6B5iAiBgYDsYRjGSbIJo4RgqDuIpIAoLoLmMCJGDKDJjJiLA7xqUAAgGTwYnYPoPmQCQGEKEJkEkFg9gGY44BoRoSmSSQ2EKEggHgRhShSZRJFYVoV" & _
	"mWCRmFKFAgGOTheheZgJgYYoYmYSYWGaF4lkMMJ0hqZpJjYbobmcCZGHKHJmjmJh0h2Z4JmYcIaE8WZ2H6H5oAoBoCiCaBKBYfdjGoJoKiKaJKDaDojmkChGgmIgpCoV" & _
	"oWiWaJZiSd4mmmSh2h6J5qAqBoiiiaY5iSeIpmqComiqKpqkqNouiuah6hqMIsmsSpWiuGhP1kOoumuSp2j6L5sAsBo54gKwWkaMZsgsJpKjKbJLDaRYxYWRpSjSbIZi" & _
	"Se41m2CxmlqNptksdpejebR5iSfI4m4S4W16boLiaao6m5fJ9jubwLkaco8m8S5WnaPZunuOp4j6b5Lnac4SA0PAGlgP4wEwFwGkGcIMCcCpCnCCxiA8NYAAmMJfkSbh" & _
	"FCcFpFnGDBnBqRpUhuEwTDeZ5lHCfw6HIQxLCaAxygyJwqgGcATE4FA6hWY4tjEAAQBAgIA==")
	End With
	.GetOcx().BackColorHeader = &H4c6c6c6
	.GetOcx().SelBackColor = &H4000000
	.SelForeColor = RGB(0,0,1)
	.set_CheckImage(EXPIVOTLib.CheckStateEnum.Unchecked,16777216)
	.set_CheckImage(EXPIVOTLib.CheckStateEnum.Checked,33554432)
	.set_CheckImage(EXPIVOTLib.CheckStateEnum.PartialChecked,50331648)
	.set_Background(EXPIVOTLib.BackgroundPartEnum.exSelBackColorFilter,.SelBackColor)
	.set_Background(EXPIVOTLib.BackgroundPartEnum.exSelForeColorFilter,.SelForeColor)
	.set_Background(EXPIVOTLib.BackgroundPartEnum.exBackColorFilter,.BackColor)
	.set_Background(EXPIVOTLib.BackgroundPartEnum.exForeColorFilter,.ForeColor)
	.set_Background(EXPIVOTLib.BackgroundPartEnum.exCursorHoverColumn,-1)
	.set_Background(EXPIVOTLib.BackgroundPartEnum.exHeaderFilterBarButton,67108864)
	.set_Background(EXPIVOTLib.BackgroundPartEnum.exHeaderFilterBarActive,67174657)
	.set_Background(EXPIVOTLib.BackgroundPartEnum.exFooterFilterBarButton,67109119)
	.HeaderAppearance = EXPIVOTLib.AppearanceEnum.Etched
	.GridLineStyle = EXPIVOTLib.GridLinesStyleEnum.exGridLinesGeometric
	.Images("gBJJgBAIDAAGAAEAAQhYAf8Pf4hh0QihCJo2AEZjQAjEZFEaIEaEEaAIAkcbk0olUrlktl0vmExmUzmk1m03nE5nU7nk9n0/oFBoVDolFo1HpFJpVLplNp1PqFRqVTq" & _
	"lVq1XrFZrVbrldr1fsFhsVjslls1ntFptVrtltt1vuFxuVzul1u13vF5vV7vl9v1/wGBwWDwmFw2HxGJxWLxmNx0xiFdyOTh8Tf9ZymXx+QytcyNgz8r0OblWjyWds+m" & _
	"0ka1Vf1ta1+r1mos2xrG2xeZ0+a0W0qOx3GO4NV3WeyvD2XJ5XL5nN51aiw+lfSj0gkUkAEllHanHI5j/cHg8EZf7w8vl8j4f/qfEZeB09/vjLAB30+kZQAP/P5/H6/y" & _
	"NAOAEAwCjMBwFAEDwJBMDwLBYAP2/8Hv8/gAGAD8LQs9w/nhDY/oygIA=")
	.Import("C:\Program Files\Exontrol\ExPivot\Sample\data.txt")
	.PivotRows = "12,0"
	.PivotColumns = "sum(5)"
	.PivotTotals = "/sum"
	.DataColumns.item(0).FormatImage = "value case (default: -1;'Germany': 1;'USA': 2;'Mexico': 3)"
	.EndUpdate()
End With
|
|
145
|
ImageSize property on 16 (default) (specifies the size of control' icons/images/check-boxes/radio-buttons)
With AxPivot1
	.BeginUpdate()
	.ImageSize = 16
	.Images("gBJJgBAIDAAEg4ACEKAD/hz/EMNh8TIRNGwAjEZAEXjAojJAjMLjABAAgjUYkUnlUrlktl0vmExmUzmk1m03nE5nU7nkrQCAntBoVDolFo1HoM/ADAplLptImdMYFOq" & _
	"dSqlXq1QrVbrlGpVWsFNrNdnNjsk7pQAtNroFnt0sh8Yr9iulTuNxs1Eu8OiT/vsnsNVutXlk/oGGtVKxGLxWNtsZtN8iUYuNvy0Zvd+xNYwdwvl4p870GCqc8vOeuVt" & _
	"tmp1knyOayWVy+WzN/ze1wOElenm+12WUz/Bv2/3UyyWrzeutux2GSyGP2dQ33C1ur3GD3M4zUNzHdlWjq/E3nGzVpjWv4HA7fRy/Tv2IrN8rPW6nZ3ve7mUlfu20Z8a" & _
	"cvQyb+vY9jasYoDwMm+LytVBDqKG3z8O3Cb8P+mkAuY9cCQ2uL4KaxDKvkp8RNLEjqugnrwQo/UWPzFyeQw5sNLZFENrI4kOqU66pw8uzmOKvTqNqjULJvGL1JO48GtT" & _
	"GsbLdEL3scxLlyiw8dQeoUVxdLTtyKmUjwGlslRPJsnK1HbAKbKCrsQo8uQk/CeP44iaR/ATnTNPLvyxPU+z9P9AUDQVBowiofJXQ6Oo+kKMpIkjztE4TKn4P6JowfgP" & _
	"nwD5/nAjB8AOeAPo0eAA1IAFH07UhAIMpYAVIYFHqBUhwVjV1S1EtQAHxW65V0AZwAeuQAnwB5gAPYViEDVhwAHTQBkCjB4gOhwDmCyhH0sACAg==")
	With .VisualAppearance
		.Add(4,"gBFLBCJwBAEHhEJAAEhABUYCg6AADACAxRDgMQBQKAAzQFAYbhkGCGAAGMZxRgmFgAQhFcZQSKUOQTDKMIziYBYfgkMIgSbJUgDGAkRRdDSOYDmGQYDiCIoRShOMIjH" & _
	"LUXxtDaIZwhEAoJb+RgAUY/cTzaAEUwHHiTKInaCQShsFYJUJAdRURQ9EwvCIZBpEWwLChENQwWLCNj2TScBwjCyqbale45ViqdoDU5EUiXJJ8ZxnECfYyrGjaMpCeKB" & _
	"UrGYTVRBIMxLLSia5oeJqMrnBpNVrIUgXCAGFwHK6BcauXIIDp6XoWWRbAAWDpVVzNNC3YzkCIceADHKiXxmVz4JLdGZ1QTGID2XaYaxWK4oZjsVSc4KDHbETbHFi9Fo" & _
	"3NaaxGisew+GYc4HlCR5NAAAIIEkQJSGMOgdE4RhYDwJJsAaAYQgmPpolCWgSCiBJzjcEIAkQXIBm8d5UhOQgCDUIBDDJDhgggJgKgKYJIDSVoDk8KBFF4OohEMZgWDs" & _
	"YYDj4GoGmGSB2B6B5iAiBgYDsYRjGSbIJo4RgqDuIpIAoLoLmMCJGDKDJjJiLA7xqUAAgGTwYnYPoPmQCQGEKEJkEkFg9gGY44BoRoSmSSQ2EKEggHgRhShSZRJFYVoV" & _
	"mWCRmFKFAgGOTheheZgJgYYoYmYSYWGaF4lkMMJ0hqZpJjYbobmcCZGHKHJmjmJh0h2Z4JmYcIaE8WZ2H6H5oAoBoCiCaBKBYfdjGoJoKiKaJKDaDojmkChGgmIgpCoV" & _
	"oWiWaJZiSd4mmmSh2h6J5qAqBoiiiaY5iSeIpmqComiqKpqkqNouiuah6hqMIsmsSpWiuGhP1kOoumuSp2j6L5sAsBo54gKwWkaMZsgsJpKjKbJLDaRYxYWRpSjSbIZi" & _
	"Se41m2CxmlqNptksdpejebR5iSfI4m4S4W16boLiaao6m5fJ9jubwLkaco8m8S5WnaPZunuOp4j6b5Lnac4SA0PAGlgP4wEwFwGkGcIMCcCpCnCCxiA8NYAAmMJfkSbh" & _
	"FCcFpFnGDBnBqRpUhuEwTDeZ5lHCfw6HIQxLCaAxygyJwqgGcATE4FA6hWY4tjEAAQBAgIA==")
	End With
	.GetOcx().BackColorHeader = &H4c6c6c6
	.GetOcx().SelBackColor = &H4000000
	.SelForeColor = RGB(0,0,1)
	.set_Background(EXPIVOTLib.BackgroundPartEnum.exSelBackColorFilter,.SelBackColor)
	.set_Background(EXPIVOTLib.BackgroundPartEnum.exSelForeColorFilter,.SelForeColor)
	.set_Background(EXPIVOTLib.BackgroundPartEnum.exBackColorFilter,.BackColor)
	.set_Background(EXPIVOTLib.BackgroundPartEnum.exForeColorFilter,.ForeColor)
	.set_Background(EXPIVOTLib.BackgroundPartEnum.exCursorHoverColumn,-1)
	.set_Background(EXPIVOTLib.BackgroundPartEnum.exHeaderFilterBarButton,67108864)
	.set_Background(EXPIVOTLib.BackgroundPartEnum.exHeaderFilterBarActive,67174657)
	.set_Background(EXPIVOTLib.BackgroundPartEnum.exFooterFilterBarButton,67109119)
	.HeaderAppearance = EXPIVOTLib.AppearanceEnum.Etched
	.GridLineStyle = EXPIVOTLib.GridLinesStyleEnum.exGridLinesGeometric
	.Import("C:\Program Files\Exontrol\ExPivot\Sample\data.txt")
	.PivotRows = "12,0"
	.PivotColumns = "sum(5)"
	.PivotTotals = "/sum"
	.DataColumns.item(0).FormatImage = "value case (default: -1;'Germany': 1;'USA': 2;'Mexico': 3)"
	.EndUpdate()
End With
|
|
144
|
Is it possible to view all events the control fires
' Event event - Notifies the application once the control fires an event.
Private Sub AxPivot1_Event(ByVal sender As System.Object, ByVal e As AxEXPIVOTLib._IPivotEvents_EventEvent) Handles AxPivot1.Event
	With AxPivot1
		Debug.Print( .get_EventParam(-2) )
	End With
End Sub

With AxPivot1
	.BeginUpdate()
	.Import("C:\Program Files\Exontrol\ExPivot\Sample\data.txt")
	.PivotBarVisible = EXPIVOTLib.PivotBarVisibleEnum.exPivotBarAllowFormatConditionalAppearance Or EXPIVOTLib.PivotBarVisibleEnum.exPivotBarAllowResizeColumns Or EXPIVOTLib.PivotBarVisibleEnum.exPivotBarAllowUndoRedo Or EXPIVOTLib.PivotBarVisibleEnum.exPivotBarAllowFormatContent Or EXPIVOTLib.PivotBarVisibleEnum.exPivotBarAllowFormatAppearance Or EXPIVOTLib.PivotBarVisibleEnum.exPivotBarAllowValues Or EXPIVOTLib.PivotBarVisibleEnum.exPivotBarShowTotals Or EXPIVOTLib.PivotBarVisibleEnum.exPivotBarAutoFit Or EXPIVOTLib.PivotBarVisibleEnum.exPivotBarSizable Or EXPIVOTLib.PivotBarVisibleEnum.exPivotBarVisible
	.EndUpdate()
End With
|
|
143
|
Does your control support images
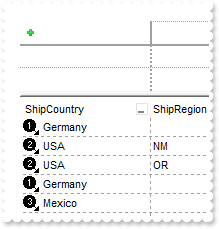
With AxPivot1
	.BeginUpdate()
	.Images("gBJJgBAIDAAGAAEAAQhYAf8Pf4hh0QihCJo2AEZjQAjEZFEaIEaEEaAIAkcbk0olUrlktl0vmExmUzmk1m03nE5nU7nk9n0/oFBoVDolFo1HpFJpVLplNp1PqFRqVTq" & _
	"lVq1XrFZrVbrldr1fsFhsVjslls1ntFptVrtltt1vuFxuVzul1u13vF5vV7vl9v1/wGBwWDwmFw2HxGJxWLxmNx0xiFdyOTh8Tf9ZymXx+QytcyNgz8r0OblWjyWds+m" & _
	"0ka1Vf1ta1+r1mos2xrG2xeZ0+a0W0qOx3GO4NV3WeyvD2XJ5XL5nN51aiw+lfSj0gkUkAEllHanHI5j/cHg8EZf7w8vl8j4f/qfEZeB09/vjLAB30+kZQAP/P5/H6/y" & _
	"NAOAEAwCjMBwFAEDwJBMDwLBYAP2/8Hv8/gAGAD8LQs9w/nhDY/oygIA=")
	.Import("C:\Program Files\Exontrol\ExPivot\Sample\data.txt")
	.DataColumns.item(0).FormatImage = "value case (default: -1;'Germany': 1;'USA': 2;'Mexico': 3)"
	.EndUpdate()
End With
|
|
142
|
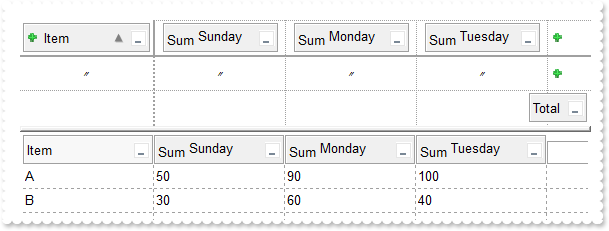
Is it possible to rename the generated-columns
With AxPivot1
	.BeginUpdate()
	.HeaderAppearance = EXPIVOTLib.AppearanceEnum.Etched
	.HeaderHeight = 24
	.Import("Item;1;2;3#A;10;20;30#A;20;40;50#A;20;30;20#B;10;10;10#B;20;50;30","str=`'` eor='#' eof=';' hdr=1")
	.PivotRows = 0
	.PivotColumns = "sum(1),sum(2),sum(3)"
	.FormatPivotHeader = "(iaggregate ? (proper(aggregate) + ` <off -4>` + (caption case (default:`None`; 1:`Sunday`; 2:`Monday`; 3:`Tuesday`; 4:`Wednesd" & _
	"ay`; 5:`Thursday`; 6:`Friday`; 7:`Saturday`))  + `</b>`) : caption)"
	.EndUpdate()
End With
|
|
141
|
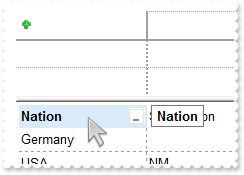
Is it possible to rename the columns
With AxPivot1
	.BeginUpdate()
	.AppendData("C:\Program Files\Exontrol\ExPivot\Sample\data.txt")
	.DataColumns.item(0).Caption = "<b>Nation"
	.Refresh()
	.EndUpdate()
End With
|
|
140
|
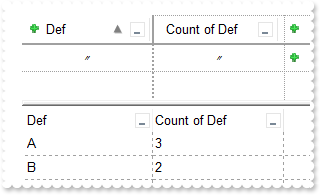
The pivot's rows and columns arer lost once I call the AppendData. Can I add/append data in the background so the layout of the pivot is not lost
Dim s
With AxPivot1
	.BeginUpdate()
	.AppendData("Def")
	.AppendData("A")
	.AppendData("A")
	.AppendData("A")
	.PivotRows = 0
	.PivotColumns = "count(0)"
	s = .Layout
	.AppendData("B")
	.AppendData("B")
	.Layout = s
	.EndUpdate()
End With
|
|
139
|
Is it possible to add data without clearing the previously data
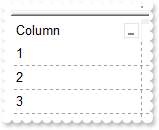
With AxPivot1
	.BeginUpdate()
	.AppendData("Column")
	.AppendData("1")
	.AppendData("2")
	.AppendData("3")
	.EndUpdate()
End With
|
|
138
|
How can I change the visual appearance of the Total button
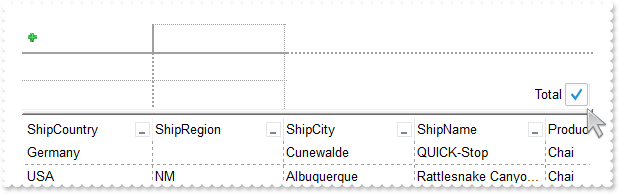
With AxPivot1
	.BeginUpdate()
	With .VisualAppearance
		.Add(2,"gBFLBCJwBAEHhEJAAEhABAoCg6AADACAxRDgMQBQKAAzQFAcDBvBgABoGEZIJhUAIIRZGMIjFDcEwxC6NIpjeIBSDUJYkSZEAyjBI8ExXFqMQCkGKocgONYgQLHcgxe" & _
	"A0XRYFoYRinWA5PoAMoyTYMdIAnTOM4eU6AATwTSccw0fisAAfeq4Wh+HwIQiUBomGahajkMqDYRVagyCI2a4ZDZCIoVJalLAxCw8KDqGJnMr1R5/MDgOBYogXBqHYhi" & _
	"OAsdhjSYdBK/WLeHI6Y1GS7MMxzLK8cxVaqfMpoMI4FjuS5NU7TMC0PAXdy3LqvbBsOxbHqma5nVSBcC2ba9cz3PK4ABuW7bM6TRKNYbkOA4LiNQaxVSrNKmIwPI5DJ5" & _
	"Ml2co1h0d5vBWDJQEkCI7mIJpykyTZblqdhYDyR5TlmX5RBgeI+D4BxLDkO5nlieh5g2FQ5DOZAiDkDASAmYh7l0RxZncPxfhadZkBmH5jvKLhamMcItBYXgoC4B4CBg" & _
	"FoskEP4hkgdgegcD4zlycA1goAJ5mIc4KjgfJ+D0ToTFGbx4h8Qh2CqDJjEeJg0gyT4DkCYg5kyAhCDeBxjkIQgDHSIgTkIP4NGGFplgGEZkkifhFgSIRHgCXwtAYeQ2" & _
	"B+DYlGkZgqgsIpnEoJxzmWGRiFqGJhmkBhDAwJBZDIYoZCYSQ+BOFAmBkJZBhKZpJlYHIXCYR4lFuHpnkmdh+h+aAKAaAogF6FhWgOIZogoJh/GuHoTl6DojmkChGhKJ" & _
	"JpEoVoWiUHAGDCTg6CmSheh6J5qAoTJriiWQUCSb4ploEwpgq4BKjWBomhmc4pAkOpRAQJQBICA==")
		.Add(1,"CP:2 -10 -6 8 8")
	End With
	.set_Background(EXPIVOTLib.BackgroundPartEnum.exPivotBarTotal,16777216)
	.Import("C:\Program Files\Exontrol\ExPivot\Sample\data.txt")
	.EndUpdate()
End With
|
|
137
|
Is it possible to highlight the column's header once a filter is applied
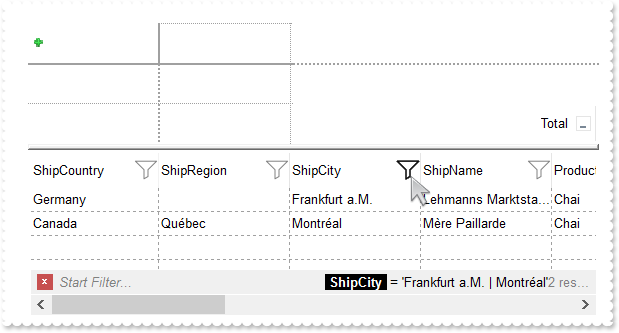
With AxPivot1
	.BeginUpdate()
	With .VisualAppearance
		.Add(2,"gBFLBCJwBAEHhEJAAEhABX8GACAADACAxSDEMQBQKAAzQFAYbhgHCGAAGQaBUgmFgAQhFcZQSKUOQTDKNYykCIRSDUJYkSZEIyjBI8ExXFqNACkGKwYgmNYiTLAcgAN" & _
	"J0WBaGIZJ4gOT5fDKMoEDRRYADFCscwxJybQAqGQKKb+VgAVY/cTyBIAEQSKA0TDOQ5TSKWB4JPZQRBEbZMNBtBIUJquKaqShdQJCU5FdY3Xblez9P7AMBwLFEC4NQ8Y" & _
	"NYuPhjR4dRTIMhvVAsUArFh8Zg9GZZFjmDIDT4ydBLTQwcyVIKnP5qOa6XbmPoCQDYKxZHYxPzVDa3axuL76dqCAT7XrXNy1TbNRrzQKfcJqfCbdw2YaDZLOOT3fjuI4" & _
	"hhKaRzFAHJ+jYQ4xHuY4gHuGIXGeExqC8Tp6C+PoEm+G5ImycRgh0XwvDGa5rgOeoejyXwnFeQp2mkf5ClgBB9gCWIYAwfYAEKV58mkdwOggNArgOXY2EWLoDkKOA0mg" & _
	"bhOGgZApgaSBIHWSYHSmbApgYThmESZYJkIeIkgeCpfliLIHgpMIcmUYYYmODAlg2SI4mWfRfGOEguDcCRjFYAJihCQhJBSDoRmONgKEcI4kFCEJhhOVYTmYnAlEAQhW" & _
	"BMJYJGYWoWmWSR2F6F5lnkWAQhUAgpEieRWEuSYkjWGpmkmNhuhuZwJkYcocmaaYkjyEhngnUA6lEFAlAEgI=")
		.Add(1,"CP:2 -8 -4 2 4")
	End With
	.HeaderHeight = 28
	.set_Background(EXPIVOTLib.BackgroundPartEnum.exHeaderFilterBarButton,33488638)
	.set_Background(EXPIVOTLib.BackgroundPartEnum.exHeaderFilterBarActive,16843009)
	.set_Background(EXPIVOTLib.BackgroundPartEnum.exCursorHoverColumn,-1)
	.Import("C:\Program Files\Exontrol\ExPivot\Sample\data.txt")
	.FilterBarFont = .Font
	.set_Description(EXPIVOTLib.DescriptionTypeEnum.exFilterBarAnd,.FormatABC("`<fgcolor=808080> ` + value + ` </fgcolor>`",.get_Description(EXPIVOTLib.DescriptionTypeEnum.exFilterBarAnd)))
	.FilterBarCaption = "(( ( value replace `[<b>` with `<bgcolor=000000><fgcolor=FFFFFF><b> ` replace `</b>]` with ` </b></bgcolor></fgcolor>` replace " & _
	"`[<s>` with `<bgcolor=C0C0C0><fgcolor=FFFFFF> ` replace `</s>]` with ` </fgcolor></bgcolor>` )  + `<r><fgcolor=808080>` + ( matc" & _
	"hitemcount < 0 ? ( ( len(value) ? `` : `` ) + `<r>` + abs(matchitemcount + 1) + ` result(s)` ) : (`<r><fgcolor=808080>`+ itemcou" & _
	"nt + ` item(s)`) )))"
	.FilterBarPromptVisible = EXPIVOTLib.FilterBarVisibleEnum.exFilterBarCompact Or EXPIVOTLib.FilterBarVisibleEnum.exFilterBarShowCloseIfRequired Or EXPIVOTLib.FilterBarVisibleEnum.exFilterBarSingleLine Or EXPIVOTLib.FilterBarVisibleEnum.exFilterBarCaptionVisible Or EXPIVOTLib.FilterBarVisibleEnum.exFilterBarVisible Or EXPIVOTLib.FilterBarVisibleEnum.exFilterBarPromptVisible
	.EndUpdate()
End With
|
|
136
|
How can I change the format the column displays (for instance, displaying no 0:00:00)
With AxPivot1
	.BeginUpdate()
	.Import("C:\Program Files\Exontrol\ExPivot\Sample\data.txt")
	.FormatContents.Add("notime","value replace `0:00:00` with ``")
	.PivotRows = "9[content=notime]"
	.EndUpdate()
End With
|
|
135
|
Is it possible to show the filterbar on top of the rows
With AxPivot1
	.BeginUpdate()
	.Import("C:\Program Files\Exontrol\ExPivot\Sample\data.txt")
	.FilterBarPromptVisible = EXPIVOTLib.FilterBarVisibleEnum.exFilterBarTop Or EXPIVOTLib.FilterBarVisibleEnum.exFilterBarShowCloseIfRequired Or EXPIVOTLib.FilterBarVisibleEnum.exFilterBarPromptVisible
	.EndUpdate()
End With
|
|
134
|
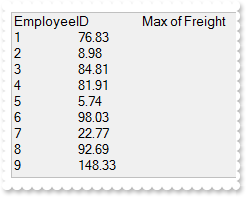
How can I uses the control in window-less mode (with no user interface, option 3)
With AxPivot1
	With CreateObject("Exontrol.Pivot")
		.Import("C:\Program Files\Exontrol\ExPivot\Sample\data.txt")
		.PivotRows = "0"
		.PivotColumns = "avg(5)"
		Debug.Print( .Export() )
	End With
End With
|
|
133
|
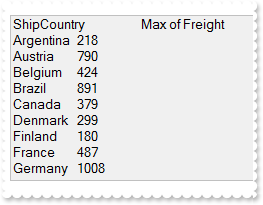
How can I uses the control in window-less mode (with no user interface, option 2)
Dim rs
With AxPivot1
	With CreateObject("Exontrol.Pivot")
		rs = CreateObject("ADOR.Recordset")
		With rs
			.Open("Data","Provider=Microsoft.ACE.OLEDB.12.0;Data Source=C:\Program Files\Exontrol\ExPivot\Sample\Access\sample.accdb",3,3)
		End With
		.DataSource = rs
		.PivotRows = "0"
		.PivotColumns = "max(5)"
		Debug.Print( .Export() )
	End With
End With
|
|
132
|
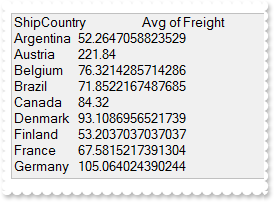
How can I uses the control in window-less mode (with no user interface, option 1)
With AxPivot1
	With CreateObject("Exontrol.Pivot")
		.LoadXML("http://www.exontrol.net/testing.xml")
		.PivotRows = "1"
		.PivotColumns = "max(6)"
		Debug.Print( .Export() )
	End With
End With
|
|
131
|
How can I connect to a DBF file
Dim rs
With AxPivot1
	.BeginUpdate()
	rs = CreateObject("ADODB.Recordset")
	With rs
		.Open("Select * From foxcode.DBF","Provider=vfpoledb;Data Source=C:\Program Files\Microsoft Visual FoxPro 9\",3,3)
	End With
	.DataSource = rs
	.PivotRows = "0"
	.PivotColumns = "count(0)[content=numeric],avg(7)[negative,content=numeric]"
	.EndUpdate()
End With
|
|
130
|
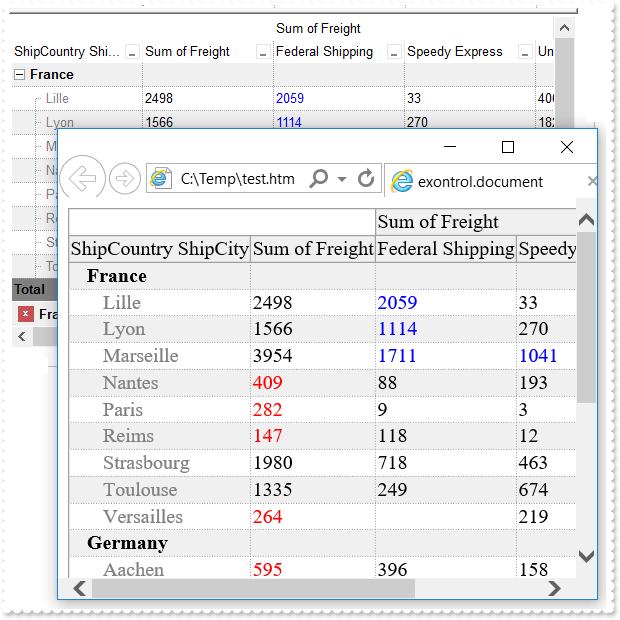
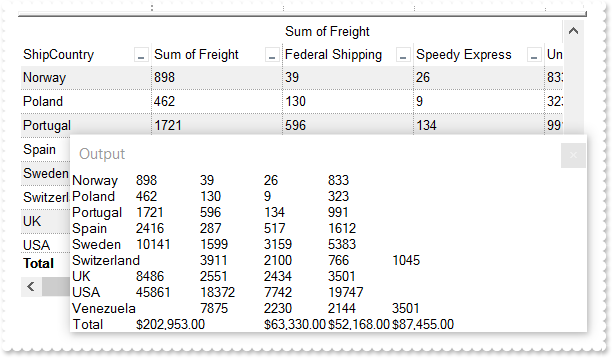
Export Data in HTML format
With AxPivot1
	.BeginUpdate()
	.Import("C:\Program Files\Exontrol\ExPivot\Sample\data.txt")
	.set_Description(EXPIVOTLib.DescriptionTypeEnum.exFilterBarAnd,.FormatABC("`<fgcolor=808080> ` + value + ` </fgcolor>`",.get_Description(EXPIVOTLib.DescriptionTypeEnum.exFilterBarAnd)))
	.FilterBarCaption = "(( ( value replace `[<b>` with `<bgcolor=000000><fgcolor=FFFFFF><b> ` replace `</b>]` with ` </b></bgcolor></fgcolor>` replace " & _
	"`[<s>` with `<bgcolor=C0C0C0><fgcolor=FFFFFF> ` replace `</s>]` with ` </fgcolor></bgcolor>` )  + `<r><fgcolor=808080>` + ( matc" & _
	"hitemcount < 0 ? ( ( len(value) ? `` : `` ) + `<r>` + abs(matchitemcount + 1) + ` result(s)` ) : (`<r><fgcolor=808080>`+ itemcou" & _
	"nt + ` item(s)`) )))"
	.FilterBarPromptVisible = EXPIVOTLib.FilterBarVisibleEnum.exFilterBarCompact Or EXPIVOTLib.FilterBarVisibleEnum.exFilterBarShowCloseIfRequired Or EXPIVOTLib.FilterBarVisibleEnum.exFilterBarSingleLine Or EXPIVOTLib.FilterBarVisibleEnum.exFilterBarCaptionVisible Or EXPIVOTLib.FilterBarVisibleEnum.exFilterBarVisible Or EXPIVOTLib.FilterBarVisibleEnum.exFilterBarPromptVisible
	With .FormatConditionalAppearances
		.Add("G1000","> 1000","value > 1000").ForeColor = RGB(0,0,255)
		.Add("L1000","< 1000","value < 1000").ForeColor = RGB(255,0,0)
		.Add("Zero","zero","value = 0").BackColor = RGB(224,224,224)
	End With
	With .FormatAppearances
		.Add("grayed").ForeColor = RGB(128,128,128)
		.Add("red").ForeColor = RGB(255,0,0)
		.Add("green").ForeColor = RGB(0,255,0)
		.Add("blue").ForeColor = RGB(0,0,255)
		.Add("bgrayed").BackColor = RGB(128,128,128)
		.Add("bred").BackColor = RGB(255,0,0)
		.Add("bgreen").BackColor = RGB(0,255,0)
		.Add("bblue").BackColor = RGB(0,0,255)
	End With
	.PivotRows = "0[bold],2[grayed]"
	.PivotColumns = "sum(5)[L1000],sum(5)[G1000]/12:A"
	.PivotTotals = "sum[bold,content=currency,bgrayed]"
	.AutoDrag = EXPIVOTLib.AutoDragEnum.exAutoDragScroll
	.BackColorAlternate = RGB(240,240,240)
	.FilterBarPromptType = EXPIVOTLib.FilterPromptEnum.exFilterPromptContainsAny
	.FilterBarPromptPattern = "France Germany"
	.EndUpdate()
	Debug.Print( .Export("htm") )
End With
|
|
129
|
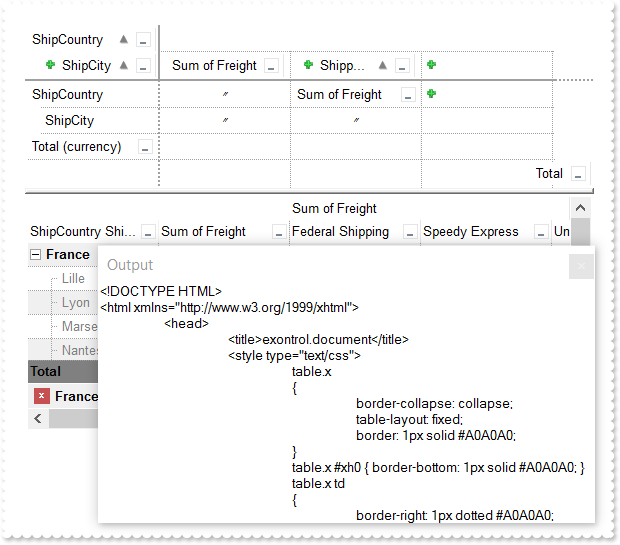
Export Data in HTML format (IE)
Dim sFile
With AxPivot1
	.BeginUpdate()
	.Import("C:\Program Files\Exontrol\ExPivot\Sample\data.txt")
	.set_Description(EXPIVOTLib.DescriptionTypeEnum.exFilterBarAnd,.FormatABC("`<fgcolor=808080> ` + value + ` </fgcolor>`",.get_Description(EXPIVOTLib.DescriptionTypeEnum.exFilterBarAnd)))
	.FilterBarCaption = "(( ( value replace `[<b>` with `<bgcolor=000000><fgcolor=FFFFFF><b> ` replace `</b>]` with ` </b></bgcolor></fgcolor>` replace " & _
	"`[<s>` with `<bgcolor=C0C0C0><fgcolor=FFFFFF> ` replace `</s>]` with ` </fgcolor></bgcolor>` )  + `<r><fgcolor=808080>` + ( matc" & _
	"hitemcount < 0 ? ( ( len(value) ? `` : `` ) + `<r>` + abs(matchitemcount + 1) + ` result(s)` ) : (`<r><fgcolor=808080>`+ itemcou" & _
	"nt + ` item(s)`) )))"
	.FilterBarPromptVisible = EXPIVOTLib.FilterBarVisibleEnum.exFilterBarCompact Or EXPIVOTLib.FilterBarVisibleEnum.exFilterBarShowCloseIfRequired Or EXPIVOTLib.FilterBarVisibleEnum.exFilterBarSingleLine Or EXPIVOTLib.FilterBarVisibleEnum.exFilterBarCaptionVisible Or EXPIVOTLib.FilterBarVisibleEnum.exFilterBarVisible Or EXPIVOTLib.FilterBarVisibleEnum.exFilterBarPromptVisible
	With .FormatConditionalAppearances
		.Add("G1000","> 1000","value > 1000").ForeColor = RGB(0,0,255)
		.Add("L1000","< 1000","value < 1000").ForeColor = RGB(255,0,0)
		.Add("Zero","zero","value = 0").BackColor = RGB(224,224,224)
	End With
	With .FormatAppearances
		.Add("grayed").ForeColor = RGB(128,128,128)
		.Add("red").ForeColor = RGB(255,0,0)
		.Add("green").ForeColor = RGB(0,255,0)
		.Add("blue").ForeColor = RGB(0,0,255)
		.Add("bgrayed").BackColor = RGB(128,128,128)
		.Add("bred").BackColor = RGB(255,0,0)
		.Add("bgreen").BackColor = RGB(0,255,0)
		.Add("bblue").BackColor = RGB(0,0,255)
	End With
	.ShowBranchRows = EXPIVOTLib.ShowBranchRowsEnum.exBranchIncludeAggregate Or EXPIVOTLib.ShowBranchRowsEnum.exBranchTree
	.PivotRows = "0[bold],2[grayed]"
	.PivotColumns = "sum(5)[L1000],sum(5)[G1000]/12:A"
	.PivotTotals = "/sum[bold,content=currency,bgrayed]"
	.AutoDrag = EXPIVOTLib.AutoDragEnum.exAutoDragScroll
	.BackColorAlternate = RGB(240,240,240)
	.FilterBarPromptType = EXPIVOTLib.FilterPromptEnum.exFilterPromptContainsAny
	.FilterBarPromptPattern = "France Germany"
	.EndUpdate()
	sFile = "c:/temp/export.htm"
	.Export(sFile,"vis")
	With CreateObject("InternetExplorer.Application")
		.Navigate2(sFile)
	End With
End With
|
|
128
|
Export Data in CSV format
With AxPivot1
	.BeginUpdate()
	.Import("C:\Program Files\Exontrol\ExPivot\Sample\data.txt")
	.PivotRows = "0"
	.PivotColumns = "sum(5),sum(5)/12:A"
	.PivotTotals = "sum[bold,content=currency]"
	.AutoDrag = EXPIVOTLib.AutoDragEnum.exAutoDragScroll
	.BackColorAlternate = RGB(240,240,240)
	.EndUpdate()
	Debug.Print( .Export() )
End With
|
|
127
|
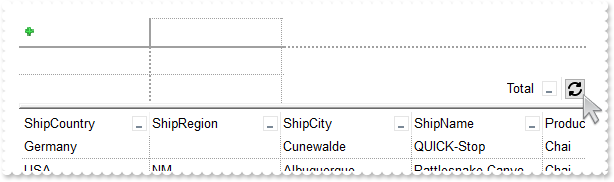
Is it possible to change the visual appearance of the update / reload button being displayed in the control's pivot bar
With AxPivot1
	.BeginUpdate()
	With .VisualAppearance
		.Add(1,"gBFLBCJwBAEHhEJAAEhABMsGACAADACAxRDgMQBQKAAzAJBIYhiG4cYCgMYxXDOCYXABCEYRXBIZQ7BKNIxjSJwCgkBYJDSMAiiaLETwHFKVRwkWBBWjMAAxDZFcggA" & _
	"77fwxHaOAghGgobjaPY+UbGERAAKQahLJamablCSqLjCS4kSLHEbQHTcRSzLKQZBBCCSQKkYx0HScRiwPBIbQkIQmbajOaYDCiQ53QLCAYRXS9PwvI7AMBwLA8EwXBo9" & _
	"DZiIy4WyuGj3R4WchAbIwIxUK6XHhmLjZXg+Bz9T6LQZ0JStEx2SYjAJqOiKU62W9xbAUOxQTpIBJXW7Oc7GTa8dQfPoJaIDLicHgoZ6NLIcOR0abSO42CRrdByfRYMw" & _
	"visCQKnYOh9i4LwbBINpBHeBxeC6X4TAIEpzkIWgei8L4Qk2boEhWPg9C4SJijIOZ7mEXA/iAX5yBKDx/lmVhEC0Z5ZlKHgGAAYIHkGcQxiCQ5eA4PghAKNgSG0VYXEi" & _
	"JYFl+QAtiCBpdjcDJkB0IgAiYIgBmIQAWCYCoigYZB4DQYpAjoLh3h6SJFgcOpXlAAQBICA==")
	End With
	.set_Background(EXPIVOTLib.BackgroundPartEnum.exPivotBarReload,16777216)
	.Import("C:\Program Files\Exontrol\ExPivot\Sample\data.txt")
	.PivotBarVisible = EXPIVOTLib.PivotBarVisibleEnum.exPivotBarAllowFormatConditionalAppearance Or EXPIVOTLib.PivotBarVisibleEnum.exPivotBarAllowResizeColumns Or EXPIVOTLib.PivotBarVisibleEnum.exPivotBarAllowUndoRedo Or EXPIVOTLib.PivotBarVisibleEnum.exPivotBarAllowFormatContent Or EXPIVOTLib.PivotBarVisibleEnum.exPivotBarAllowFormatAppearance Or EXPIVOTLib.PivotBarVisibleEnum.exPivotBarAllowValues Or EXPIVOTLib.PivotBarVisibleEnum.exPivotBarShowTotals Or EXPIVOTLib.PivotBarVisibleEnum.exPivotBarAutoFit Or EXPIVOTLib.PivotBarVisibleEnum.exPivotBarSizable Or EXPIVOTLib.PivotBarVisibleEnum.exPivotBarVisible
	.EndUpdate()
End With
|
|
126
|
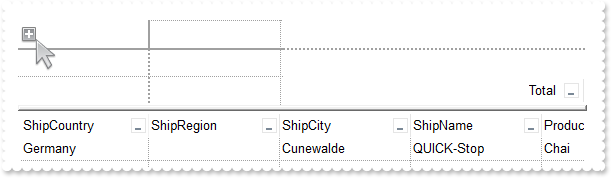
Is it possible to change the visual appearance of the plus/add new button being displayed in the control's pivot bar
With AxPivot1
	.BeginUpdate()
	With .VisualAppearance
		.Add(1,"gBFLBCJwBAEHhEJAAEhABDwCg6AADACAxRDgMQBQKAAzAJBIYhiG4cYCgMYxXDOCYXABCEYRXBIZQ7BKNIxjSJ5BhIAAyDSJMjSRJUEhqGCWYDleYYYAKHIMQLJQKQS" & _
	"BcQR9EaBZBAWTpQC0OJDTJRI4TNAgbSYAAYRqoCb6loTKypaxjCQQIgkUBpGKdBynEYsDwSGyJCCJWyIbpKAwoVbcs4AYhuJpaQi+d5PFbjVT8dLAMBwLA8EwXAJ+Opf" & _
	"DxXU7eFKpR5fchXTI8UxXFqXZhkeQrfh7KYVRBKdBQRBEFQPJqnahqOpaXo2RoLUJKcQwHTmHYNQTALyuTALZrWeZ3XrgN74LbtZzVQauYRpbCMEr6bpoWLnFi6Ho1U4" & _
	"llWah1jqSweFqfxPgQQRphi+Yak0YIuqUfJegef4zluaJ3nqPJeCYH4BAeX5TDLBpVGqKRRnwf4flefZtHsX54BYAR/F+EwVnUd5eAMMJKDIChygyIQpAoEh4iIJ5Jlg" & _
	"XIcgCXpIGoFwnGEQh6BEKBgmMIICHgIJCAiUAzgyUoAhwJohkiRgygwYpiGoKwzGIcgKCkNQNCMRIbCYCRYk4QoMiOchWDwNBjhiJJaDYTRiGiFwlCQAhOE8JBJHITIR" & _
	"gwZRZFCFCZBkOIUhKTRpCWAwgGYQ4El4NxlBifIWCcCYCFoaoMGaKYyG6GxlBmGJdhkCAWBIeA5g4U4QhMJAImkPIShRVxGgQJRlCIUISh+SJpnCZIeBgFgiHgO4OlOM" & _
	"INCISByECDQikkGhuh2JwpmqBogCKaYiC6FwhmkQ4yHgYgYiaHopiuaRakCbIsisSpGjYOwaHYKYMCkK5CA2IxrCwCwFigaJrkLTI6lcdANAEgIA=")
	End With
	.set_Background(EXPIVOTLib.BackgroundPartEnum.exPivotBarAddNew,16777216)
	.Import("C:\Program Files\Exontrol\ExPivot\Sample\data.txt")
	.EndUpdate()
End With
|
|
125
|
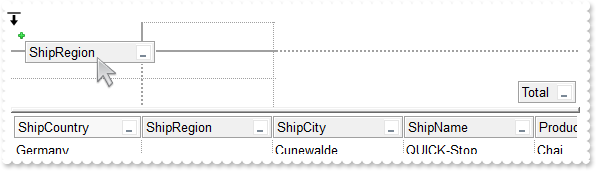
Is it possible to change the visual appearance of the position signs when user changes the column's position by drag and drop
With AxPivot1
	.BeginUpdate()
	.HeaderAppearance = EXPIVOTLib.AppearanceEnum.Etched
	With .VisualAppearance
		.Add(1,"gBFLBCJwBAEHhEJAAEhABZEGACAADACAxRDgMQBQKAAzAJBIYhiG4cYCgMYxXDOCYXABCEYRXBIZQ7BKNIxjSJwFgmEgADKMA4SOKIZhrE4bBhGaQRUgyI43RhHUBzV" & _
	"IUcQvE6TZRHCQYHgkNIhDJIM7TPLkeSVJaTIRoKhJUogApQThTMgVRDEThkGoSa6soSoYTDBKybLrSLKagOT5YUDKUqSdKEZRpEq1YztWbaQoCUoqVRRVIWfbNd4JJa4" & _
	"aDhWpYdpeeY5R7bWLgBYVVABL7LLRsSxpHxPF6RXxaeI3GKsaS8G6ic6nPQMHj7I4NS5pUa6Rh2VYNSa8AAtETRYznOw4bTMXAjNIea5bAYIIR5HIoDzVbQcCQAHL9DB" & _
	"eEMIQEEISgGhMGZQmocgymoYRRCIEQ0G2HYBnEIBig4V4zCQGINnmagCECY43medZ6H2Pw/g+X5fnueh/h+R5+AKABfkMWgGgGYA4AICoCGCE5WA4CphACMgSD2IRIDI" & _
	"BICmEd5YGCBpRjGBgegWIYIgWdgoGIRQsiKCZiAiJZ0gGQI4jUS4LECOAiBmDJflGfg2BSY4Al4OhGkOCJ2DgFJjGGfgqgiH5Ch4RhGkqOQmEOEpkFkHQYhJRYyESAok" & _
	"GKHhIhKIxJEmf4VGUeRGFmF5iBkchPhYJQ5GoYIZg6Ug6GoFYmkmNhuhulRGHKGoImefh0BUZ4JmYeoemeSZ2H6HQmgoBgXDqXwUAQgI=")
		.Add(2,"CP:1 0 -36 0 0")
	End With
	.set_Background(EXPIVOTLib.BackgroundPartEnum.exColumnsPositionSign,33554432)
	.Import("C:\Program Files\Exontrol\ExPivot\Sample\data.txt")
	.EndUpdate()
End With
|
|
124
|
FilterBarCaption ALL Keyword ( sample 2, result )
With AxPivot1
	.BeginUpdate()
	.Import("C:\Program Files\Exontrol\ExPivot\Sample\data.txt")
	.FilterBarFont = .Font
	.set_Description(EXPIVOTLib.DescriptionTypeEnum.exFilterBarAnd,.FormatABC("`<fgcolor=808080> ` + value + ` </fgcolor>`",.get_Description(EXPIVOTLib.DescriptionTypeEnum.exFilterBarAnd)))
	.FilterBarCaption = "(( ( value replace `[<b>` with `<bgcolor=000000><fgcolor=FFFFFF><b> ` replace `</b>]` with ` </b></bgcolor></fgcolor>` replace " & _
	"`[<s>` with `<bgcolor=C0C0C0><fgcolor=FFFFFF> ` replace `</s>]` with ` </fgcolor></bgcolor>` )  + `<r><fgcolor=808080>` + ( matc" & _
	"hitemcount < 0 ? ( ( len(value) ? `` : `` ) + `<r>` + abs(matchitemcount + 1) + ` result(s)` ) : (`<r><fgcolor=808080>`+ itemcou" & _
	"nt + ` item(s)`) )))"
	.FilterBarPromptVisible = EXPIVOTLib.FilterBarVisibleEnum.exFilterBarCompact Or EXPIVOTLib.FilterBarVisibleEnum.exFilterBarShowCloseIfRequired Or EXPIVOTLib.FilterBarVisibleEnum.exFilterBarSingleLine Or EXPIVOTLib.FilterBarVisibleEnum.exFilterBarCaptionVisible Or EXPIVOTLib.FilterBarVisibleEnum.exFilterBarVisible Or EXPIVOTLib.FilterBarVisibleEnum.exFilterBarPromptVisible
	.EndUpdate()
End With
|
|
123
|
FilterBarCaption ALL Keyword ( sample 1 )
With AxPivot1
	.BeginUpdate()
	.Import("C:\Program Files\Exontrol\ExPivot\Sample\data.txt")
	.FilterBarFont = .Font
	.set_Description(EXPIVOTLib.DescriptionTypeEnum.exFilterBarAnd,.FormatABC("`<fgcolor=808080> ` + value + ` </fgcolor>`",.get_Description(EXPIVOTLib.DescriptionTypeEnum.exFilterBarAnd)))
	.FilterBarCaption = "all"
	.FilterBarPromptVisible = EXPIVOTLib.FilterBarVisibleEnum.exFilterBarVisible Or EXPIVOTLib.FilterBarVisibleEnum.exFilterBarPromptVisible
	.EndUpdate()
End With
|
|
122
|
FilterBarCaption ALLUI Keyword ( sample 2, result )
With AxPivot1
	.BeginUpdate()
	.Import("C:\Program Files\Exontrol\ExPivot\Sample\data.txt")
	.FilterBarFont = .Font
	.set_Description(EXPIVOTLib.DescriptionTypeEnum.exFilterBarAnd,.FormatABC("`<fgcolor=808080> ` + value + ` </fgcolor>`",.get_Description(EXPIVOTLib.DescriptionTypeEnum.exFilterBarAnd)))
	.FilterBarCaption = "(( ( allui replace `[<b>` with `<bgcolor=000000><fgcolor=FFFFFF><b> ` replace `</b>]` with ` </b></bgcolor></fgcolor>` replace " & _
	"`[<s>` with `<bgcolor=C0C0C0><fgcolor=FFFFFF> ` replace `</s>]` with ` </fgcolor></bgcolor>` )  + `<r><fgcolor=808080>` + ( matc" & _
	"hitemcount < 0 ? ( ( len(value) ? `` : `` ) + `<r>` + abs(matchitemcount + 1) + ` result(s)` ) : (`<r><fgcolor=808080>`+ itemcou" & _
	"nt + ` item(s)`) )))"
	.FilterBarPromptVisible = EXPIVOTLib.FilterBarVisibleEnum.exFilterBarVisible Or EXPIVOTLib.FilterBarVisibleEnum.exFilterBarPromptVisible
	.EndUpdate()
End With
|
|
121
|
FilterBarCaption ALLUI Keyword ( sample 1 )
With AxPivot1
	.BeginUpdate()
	.Import("C:\Program Files\Exontrol\ExPivot\Sample\data.txt")
	.FilterBarFont = .Font
	.set_Description(EXPIVOTLib.DescriptionTypeEnum.exFilterBarAnd,.FormatABC("`<fgcolor=808080> ` + value + ` </fgcolor>`",.get_Description(EXPIVOTLib.DescriptionTypeEnum.exFilterBarAnd)))
	.FilterBarCaption = "allui"
	.FilterBarPromptVisible = EXPIVOTLib.FilterBarVisibleEnum.exFilterBarVisible Or EXPIVOTLib.FilterBarVisibleEnum.exFilterBarPromptVisible
	.EndUpdate()
End With
|
|
120
|
FilterBarCaption AVAILABLE Keyword ( sample 2, result )
With AxPivot1
	.BeginUpdate()
	.Import("C:\Program Files\Exontrol\ExPivot\Sample\data.txt")
	.FilterBarFont = .Font
	.set_Description(EXPIVOTLib.DescriptionTypeEnum.exFilterBarAnd,.FormatABC("`<fgcolor=808080> ` + value + ` </fgcolor>`",.get_Description(EXPIVOTLib.DescriptionTypeEnum.exFilterBarAnd)))
	.FilterBarCaption = "(( ( value replace `[` with `<bgcolor=000000><fgcolor=FFFFFF><b> ` replace `]` with ` </b></bgcolor></fgcolor>` ) + ` ` + ( ava" & _
	"ilable replace `[` with `<bgcolor=C0C0C0><fgcolor=FFFFFF><b> ` replace `]` with ` </b></bgcolor></fgcolor>` replace `<s>` with `" & _
	"` replace `</s>` with `` ) + `<fgcolor=808080>` + ( matchitemcount < 0 ? ( ( len(value) ? `` : `` ) + `<r>` + abs(matchitemcount" & _
	" + 1) + ` result(s)` ) : (`<r><fgcolor=808080>`+ itemcount + ` item(s)`) )))"
	.FilterBarPromptVisible = EXPIVOTLib.FilterBarVisibleEnum.exFilterBarVisible Or EXPIVOTLib.FilterBarVisibleEnum.exFilterBarPromptVisible
	.EndUpdate()
End With
|
|
119
|
FilterBarCaption AVAILABLE Keyword ( sample 1 )
With AxPivot1
	.BeginUpdate()
	.Import("C:\Program Files\Exontrol\ExPivot\Sample\data.txt")
	.FilterBarFont = .Font
	.set_Description(EXPIVOTLib.DescriptionTypeEnum.exFilterBarAnd,.FormatABC("`<fgcolor=808080> ` + value + ` </fgcolor>`",.get_Description(EXPIVOTLib.DescriptionTypeEnum.exFilterBarAnd)))
	.FilterBarCaption = "value + ` ` + available"
	.FilterBarPromptVisible = EXPIVOTLib.FilterBarVisibleEnum.exFilterBarVisible Or EXPIVOTLib.FilterBarVisibleEnum.exFilterBarPromptVisible
	.EndUpdate()
End With
|
|
118
|
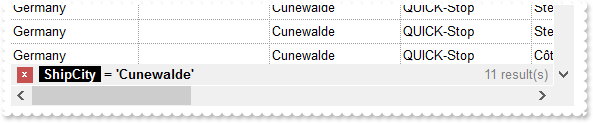
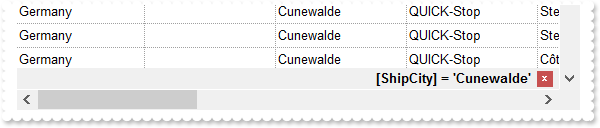
Is it possible to somehow highlight the column's name different than its filter value in the control's filter bar ( sample 3, results )
With AxPivot1
	.BeginUpdate()
	.Import("C:\Program Files\Exontrol\ExPivot\Sample\data.txt")
	.FilterBarFont = .Font
	.set_Description(EXPIVOTLib.DescriptionTypeEnum.exFilterBarAnd,.FormatABC("`<fgcolor=808080>` + value + `</fgcolor>`",.get_Description(EXPIVOTLib.DescriptionTypeEnum.exFilterBarAnd)))
	.FilterBarCaption = "(`<b>` + value + `</b><fgcolor=808080>` + ( matchitemcount < 0 ? ( ( len(value) ? `` : `` ) + `<r>` + abs(matchitemcount + 1) +" & _
	" ` result(s)` ) : (`<fgcolor=808080>`+ itemcount + ` item(s)`) )) replace `[` with `<bgcolor=000000><fgcolor=FFFFFF><b> ` replac" & _
	"e `]` with ` </b></bgcolor></fgcolor>`"
	.FilterBarPromptVisible = EXPIVOTLib.FilterBarVisibleEnum.exFilterBarToggle
	.EndUpdate()
End With
|
|
117
|
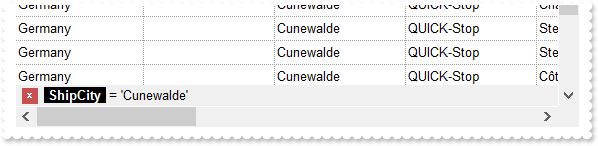
Is it possible to somehow highlight the column's name different than its filter value in the control's filter bar ( sample 2 )
With AxPivot1
	.BeginUpdate()
	.Import("C:\Program Files\Exontrol\ExPivot\Sample\data.txt")
	.FilterBarFont = .Font
	.set_Description(EXPIVOTLib.DescriptionTypeEnum.exFilterBarAnd,.FormatABC("`<fgcolor=808080>` + value + `</fgcolor>`",.get_Description(EXPIVOTLib.DescriptionTypeEnum.exFilterBarAnd)))
	.FilterBarCaption = "value replace `[` with `<bgcolor=000000><fgcolor=FFFFFF><b> ` replace `]` with ` </b></bgcolor></fgcolor>`"
	.FilterBarPromptVisible = EXPIVOTLib.FilterBarVisibleEnum.exFilterBarToggle
	.EndUpdate()
End With
|
|
116
|
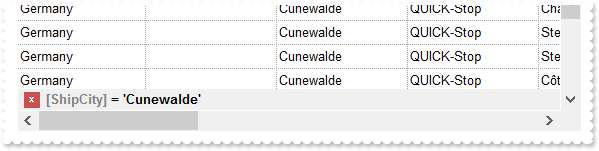
Is it possible to somehow highlight the column's name different than its filter value in the control's filter bar ( sample 1 )
With AxPivot1
	.BeginUpdate()
	.Import("C:\Program Files\Exontrol\ExPivot\Sample\data.txt")
	.set_Description(EXPIVOTLib.DescriptionTypeEnum.exFilterBarAnd,.FormatABC("`<fgcolor=808080>` + value + `</fgcolor>`",.get_Description(EXPIVOTLib.DescriptionTypeEnum.exFilterBarAnd)))
	.FilterBarCaption = "value replace `[` with `<fgcolor=808080>[` replace `]` with `]</fgcolor>`"
	.FilterBarPromptVisible = EXPIVOTLib.FilterBarVisibleEnum.exFilterBarToggle
	.EndUpdate()
End With
|
|
115
|
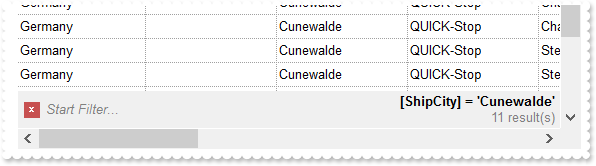
Is it possible to automatically displays the control's filter label to the right
With AxPivot1
	.BeginUpdate()
	.Import("C:\Program Files\Exontrol\ExPivot\Sample\data.txt")
	.FilterBarCaption = "`<r>` + value"
	.FilterBarPromptVisible = EXPIVOTLib.FilterBarVisibleEnum.exFilterBarShowCloseOnRight Or EXPIVOTLib.FilterBarVisibleEnum.exFilterBarToggle
	.EndUpdate()
End With
|
|
114
|
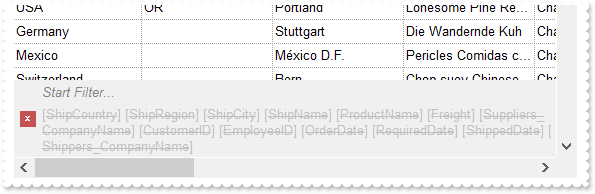
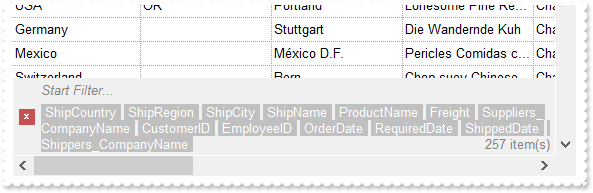
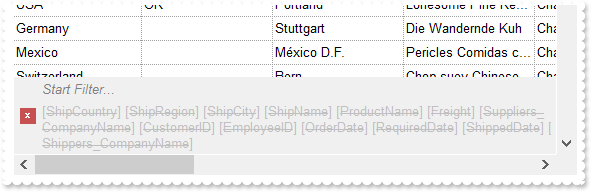
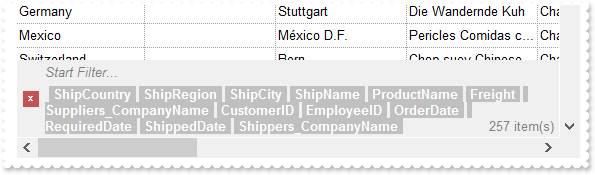
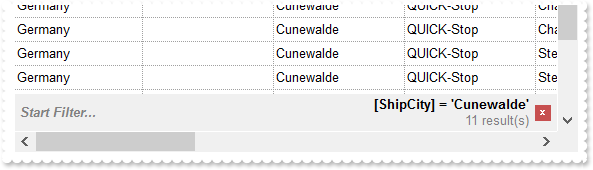
How can I get the number of results/items being shown in the control's filter bar (sample 4)
With AxPivot1
	.BeginUpdate()
	.Import("C:\Program Files\Exontrol\ExPivot\Sample\data.txt")
	.FilterBarFont = .Font
	.FilterBarPrompt = .FormatABC("`<b>` + value",.FilterBarPrompt)
	.FilterBarCaption = "`<b><r>` + value + `</b><fgcolor=808080>` + ( matchitemcount < 0 ? ( ( len(value) ? `<br>` : `` ) + `<r>` + abs(matchitemcount " & _
	"+ 1) + ` result(s)` ) : (`<fgcolor=808080>`+ itemcount + ` item(s)`) )"
	.FilterBarPromptVisible = EXPIVOTLib.FilterBarVisibleEnum.exFilterBarCompact Or EXPIVOTLib.FilterBarVisibleEnum.exFilterBarShowCloseOnRight Or EXPIVOTLib.FilterBarVisibleEnum.exFilterBarShowCloseIfRequired Or EXPIVOTLib.FilterBarVisibleEnum.exFilterBarCaptionVisible Or EXPIVOTLib.FilterBarVisibleEnum.exFilterBarVisible Or EXPIVOTLib.FilterBarVisibleEnum.exFilterBarPromptVisible
	.EndUpdate()
End With
|
|
113
|
How can I get the number of results being shown in the control's filter bar (sample 3)
With AxPivot1
	.BeginUpdate()
	.Import("C:\Program Files\Exontrol\ExPivot\Sample\data.txt")
	.FilterBarFont = .Font
	.FilterBarCaption = "`<b><r>` + value + `</b><fgcolor=808080>` + ( matchitemcount < 0 ? ( ( len(value) ? `<br>` : `` ) + `<r>` + abs(matchitemcount " & _
	"+ 1) + ` result(s)` ) : ``)"
	.FilterBarPromptVisible = EXPIVOTLib.FilterBarVisibleEnum.exFilterBarCompact Or EXPIVOTLib.FilterBarVisibleEnum.exFilterBarCaptionVisible Or EXPIVOTLib.FilterBarVisibleEnum.exFilterBarVisible Or EXPIVOTLib.FilterBarVisibleEnum.exFilterBarPromptVisible
	.EndUpdate()
End With
|
|
112
|
How can I get the number of results being shown in the control's filter bar (sample 2, compact)
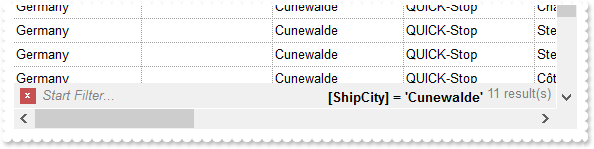
With AxPivot1
	.BeginUpdate()
	.Import("C:\Program Files\Exontrol\ExPivot\Sample\data.txt")
	.FilterBarFont = .Font
	.FilterBarCaption = "`<b><r>` + value + `</b><fgcolor=808080>` + ( matchitemcount < 0 ? `<off -4> ` + abs(matchitemcount + 1) + ` result(s)` : ``)"
	.FilterBarPromptVisible = EXPIVOTLib.FilterBarVisibleEnum.exFilterBarCompact Or EXPIVOTLib.FilterBarVisibleEnum.exFilterBarSingleLine Or EXPIVOTLib.FilterBarVisibleEnum.exFilterBarCaptionVisible Or EXPIVOTLib.FilterBarVisibleEnum.exFilterBarVisible Or EXPIVOTLib.FilterBarVisibleEnum.exFilterBarPromptVisible
	.EndUpdate()
End With
|
|
111
|
How can I get the number of results being shown in the control's filter bar (sample 1)
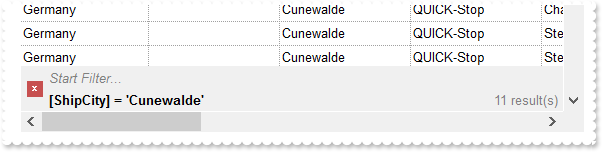
With AxPivot1
	.BeginUpdate()
	.Import("C:\Program Files\Exontrol\ExPivot\Sample\data.txt")
	.FilterBarFont = .Font
	.FilterBarCaption = "`<b>` + value + `</b><r><fgcolor=808080>` + ( matchitemcount < 0 ? abs(matchitemcount + 1) + ` result(s)` : ``)"
	.FilterBarPromptVisible = EXPIVOTLib.FilterBarVisibleEnum.exFilterBarCaptionVisible Or EXPIVOTLib.FilterBarVisibleEnum.exFilterBarVisible Or EXPIVOTLib.FilterBarVisibleEnum.exFilterBarPromptVisible
	.EndUpdate()
End With
|
|
110
|
FilterBarCaption Predefined Keywords
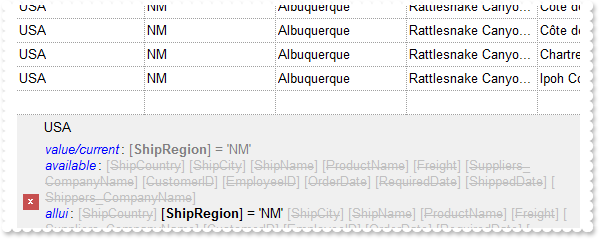
With AxPivot1
	.BeginUpdate()
	.Import("C:\Program Files\Exontrol\ExPivot\Sample\data.txt")
	.LinesAtRoot = EXPIVOTLib.LinesAtRootEnum.exLinesAtRoot
	.FilterInclude = EXPIVOTLib.FilterIncludeEnum.exItemsWithChilds
	.FilterBarFont = .Font
	.FilterBarCaption = "`<fgcolor=0000FF><i>value/current</i></fgcolor>: <fgcolor=808080>` + value + `</fgcolor>` + `<br><fgcolor=0000FF><i>available</" & _
	"i></fgcolor>: ` + available + `<br><fgcolor=0000FF><i>allui</i></fgcolor>: ` + allui + `<br><fgcolor=0000FF><i>all</i></fgcolor>" & _
	": ` + all + `<br><fgcolor=0000FF><i>itemcount</i></fgcolor>: <fgcolor=808080>` + itemcount + `</fgcolor>`+ `<br><fgcolor=0000FF>" & _
	"<i>visibleitemcount</i></fgcolor>: <fgcolor=808080>` + visibleitemcount + `</fgcolor>`+ `<br><fgcolor=0000FF><i>matchitemcount</" & _
	"i></fgcolor>: <fgcolor=808080>` + matchitemcount + `</fgcolor>`+ `<br><fgcolor=0000FF><i>promptpattern</i></fgcolor>: <fgcolor=8" & _
	"08080>` + promptpattern + `</fgcolor>`+ `<br><fgcolor=0000FF><i>leafitemcount</i></fgcolor>: <fgcolor=808080>` + leafitemcount +" & _
	" `</fgcolor>`"
	.FilterBarPromptPattern = "USA"
	.FilterBarPromptVisible = EXPIVOTLib.FilterBarVisibleEnum.exFilterBarCaptionVisible Or EXPIVOTLib.FilterBarVisibleEnum.exFilterBarVisible Or EXPIVOTLib.FilterBarVisibleEnum.exFilterBarPromptVisible
	.EndUpdate()
End With
|
|
109
|
I am using filter prompt feature, and also column's filter, just wondering if possible to compact displaying the filter bar so it won't show on multiple lines
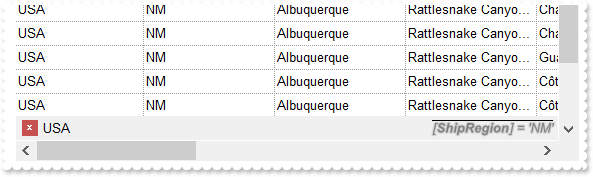
With AxPivot1
	.BeginUpdate()
	.Import("C:\Program Files\Exontrol\ExPivot\Sample\data.txt")
	.FilterBarFont = .Font
	.FilterBarCaption = "`<r><i><fgcolor=808080><upline><solidline><sha ;;0>` + value"
	.FilterBarPromptPattern = "USA"
	.FilterBarPromptVisible = EXPIVOTLib.FilterBarVisibleEnum.exFilterBarCompact Or EXPIVOTLib.FilterBarVisibleEnum.exFilterBarSingleLine Or EXPIVOTLib.FilterBarVisibleEnum.exFilterBarVisible Or EXPIVOTLib.FilterBarVisibleEnum.exFilterBarPromptVisible
	.EndUpdate()
End With
|
|
108
|
Just wondering if it is possible to show the filter bar's close button on the right ( sample 2 )
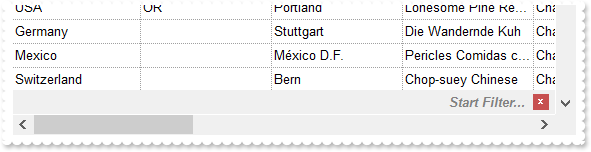
With AxPivot1
	.BeginUpdate()
	.Import("C:\Program Files\Exontrol\ExPivot\Sample\data.txt")
	.FilterBarPromptVisible = EXPIVOTLib.FilterBarVisibleEnum.exFilterBarShowCloseOnRight Or EXPIVOTLib.FilterBarVisibleEnum.exFilterBarToggle Or EXPIVOTLib.FilterBarVisibleEnum.exFilterBarPromptVisible
	.FilterBarPrompt = .FormatABC("`<r>` + value",.FilterBarPrompt)
	.EndUpdate()
End With
|
|
107
|
How can I change the visual appearance of the filter bar's close button (EBN)
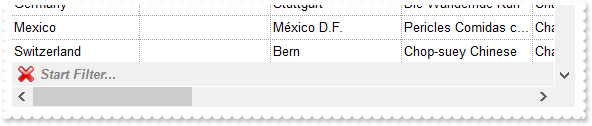
With AxPivot1
	.BeginUpdate()
	With .VisualAppearance
		.Add(1,"gBFLBCJwBAEHhEJAAEhABHQDg6AADACAxRDgMQBQKAAzAJBIYhiG4cYCgMZhXDOCYXABCEYRXBIZQ7BKNIxjSJ5BhIAAyDSJMjSRJUEhqGCWYDleYYYAKHIMQLOg7IJ" & _
	"jyI4/SJAYCydKAWhxIaZKJHCZoEDaTAADCNVAQp6MEIJVbVEI0e79OgBLp/Z7kECIJJAaRjHQdJxGLA8EhtCQhCZteK6SgMKJYXhWQYRXI1JwvMBrWrdQjiOYELQtMKm" & _
	"SZNLYGG4dR5SVJbcYhSYsRRFMoyDIOXYDLKsdYqSpXIThObEGgaPqJYjsUjCMKnR7HVIURrBPC9TBPE69ZgmC6ucKPX51ShKFaBWDZcwFAS+UBuYCAILiEAQGZ1XT8OR" & _
	"OicbgJgSTJRlCaZeDsHY7QGR4xkSYp3CaExZAQMgalQYAwjCAAfBANxcA2TgKAUOpDCGFhKg0RpXCwCwDHQHQHEyAIkCkOhbFOGA8A8DohBgRg9AccZcn8EpEjMLI2C2" & _
	"DYxAgQgvAIUIVkoAAPBQDJlECTZ3CCYwDACQwUA8A5MCAWAWDiQi4l8aQOEgLJuBgBgDmYFAzEoIoIl0WALgKYJbBABADAAHgHg8VAMmqCQQDMXABAATYwTmNwBDATJX" & _
	"AiAgjHmNQ5lgQ5QEQEQMmcWg/GwD5ylyNw2gMcJcjsBgBgOQQDDhRpVAMMwnDBFw1B0Ax8D0DxOmmJJIGQTY5hGMAwkwM4CAYLZAmAOJnAqAojiIGg6iieYkmeAYOHaK" & _
	"JDCyCwjH6AoggsQpQliAJLhgaJ0CESBTnyDwjk+cg4g4P5IHIHJ+BWRRzlYWAxiOUxihsY4KjKLJRGqC44FCegkkkM58iAKAPnIWIWD8SRSFSfQnkmewUhYP4GiGKJ7G" & _
	"0TIbCSUoggqUo0lAQ4LnEcBcD8Coiiif4nE+eAAn2HpOkcFJqi4T5SkyMw/kqQown8IBIBOdA+A+DJrBqVxXEqYo4lCApLhGHBnD8S4ymyfxmg+cwQkQP5egOUZIWoEA" & _
	"kjIeIPBMBJBD+TBjBifwvkuc58hQJQPmFrYykkchclSApKjGOBuD+TRDFCfw3mmIxNi8FxFlOXhVC4aYDFyPgvg2YBcBcLZGCGCJ0DSLRzGSWQ/lmY5+mEP5gmMDBZRS" & _
	"MRsFsOxMhMJJ/DsTpTnwaQaE+N5ojuNhdEYNI5C4TZJO1GRDmCaxnA2Yx4n8IpIjOTBQBQC5TgyYw7gUYRYikC0BYRwsDQBoB8eA6Q2hsE0BUXgywZtYCyHMKwnxSAhA" & _
	"QHkIQhRrBaDsCwA4ERiB2EWAIYIXhhiVEgAEUYwwYjyASLge4FhHgRDkM8OQih0jWPkGgBBAQ")
	End With
	.Import("C:\Program Files\Exontrol\ExPivot\Sample\data.txt")
	.FilterBarPromptVisible = EXPIVOTLib.FilterBarVisibleEnum.exFilterBarToggle Or EXPIVOTLib.FilterBarVisibleEnum.exFilterBarPromptVisible
	.set_Background(EXPIVOTLib.BackgroundPartEnum.exFooterFilterBarButton,16777216)
	.EndUpdate()
End With
|
|
106
|
How can I change the visual appearance of the filter bar's close button (solid)
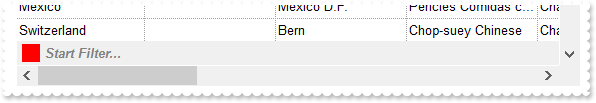
With AxPivot1
	.BeginUpdate()
	.Import("C:\Program Files\Exontrol\ExPivot\Sample\data.txt")
	.FilterBarPromptVisible = EXPIVOTLib.FilterBarVisibleEnum.exFilterBarPromptVisible
	.set_Background(EXPIVOTLib.BackgroundPartEnum.exFooterFilterBarButton,255)
	.EndUpdate()
End With
|
|
105
|
Is it possible to prevent definitely showing the filter bar's close button
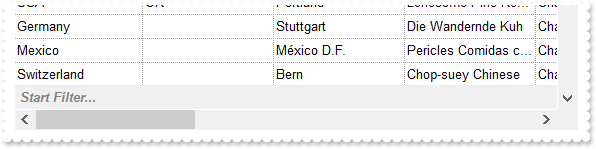
With AxPivot1
	.BeginUpdate()
	.Import("C:\Program Files\Exontrol\ExPivot\Sample\data.txt")
	.FilterBarPromptVisible = EXPIVOTLib.FilterBarVisibleEnum.exFilterBarPromptVisible
	.set_Background(EXPIVOTLib.BackgroundPartEnum.exFooterFilterBarButton,-1)
	.EndUpdate()
End With
|
|
104
|
Is it possible to show the close button only if there is a filter applied
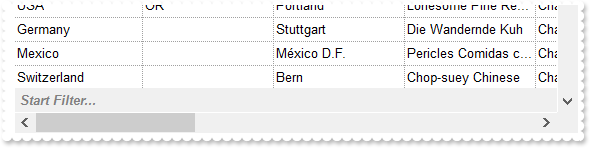
With AxPivot1
	.BeginUpdate()
	.Import("C:\Program Files\Exontrol\ExPivot\Sample\data.txt")
	.FilterBarPromptVisible = EXPIVOTLib.FilterBarVisibleEnum.exFilterBarShowCloseIfRequired Or EXPIVOTLib.FilterBarVisibleEnum.exFilterBarPromptVisible
	.EndUpdate()
End With
|
|
103
|
The control's filter bar is not closed once I click the close button (toggle)
With AxPivot1
	.BeginUpdate()
	.Import("C:\Program Files\Exontrol\ExPivot\Sample\data.txt")
	.FilterBarCaption = "`<r><fgcolor=808080>` + value"
	.FilterBarPromptPattern = "USA"
	.FilterBarPromptVisible = EXPIVOTLib.FilterBarVisibleEnum.exFilterBarCompact Or EXPIVOTLib.FilterBarVisibleEnum.exFilterBarToggle Or EXPIVOTLib.FilterBarVisibleEnum.exFilterBarSingleLine Or EXPIVOTLib.FilterBarVisibleEnum.exFilterBarVisible Or EXPIVOTLib.FilterBarVisibleEnum.exFilterBarPromptVisible
	.EndUpdate()
End With
|
|
102
|
How can I display the control's filter on a single line
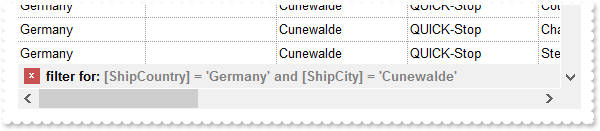
With AxPivot1
	.BeginUpdate()
	.Import("C:\Program Files\Exontrol\ExPivot\Sample\data.txt")
	.FilterBarCaption = "len(value) ? `filter for: <fgcolor 808080>` + value  : `<fgcolor 808080>no filter`"
	.FilterBarPromptVisible = EXPIVOTLib.FilterBarVisibleEnum.exFilterBarSingleLine Or EXPIVOTLib.FilterBarVisibleEnum.exFilterBarVisible
	.EndUpdate()
End With
|
|
101
|
How can I display the control's filter on a single line (prompt-combined)
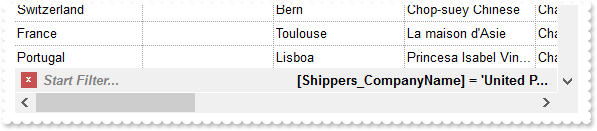
With AxPivot1
	.BeginUpdate()
	.Import("C:\Program Files\Exontrol\ExPivot\Sample\data.txt")
	.FilterBarCaption = "`<r>` + value"
	.FilterBarPromptVisible = EXPIVOTLib.FilterBarVisibleEnum.exFilterBarCompact Or EXPIVOTLib.FilterBarVisibleEnum.exFilterBarSingleLine Or EXPIVOTLib.FilterBarVisibleEnum.exFilterBarVisible Or EXPIVOTLib.FilterBarVisibleEnum.exFilterBarPromptVisible
	.EndUpdate()
End With
|