

| Name | Value | Description | |||
| exHide | 0 | No point, line or value is shown | |||
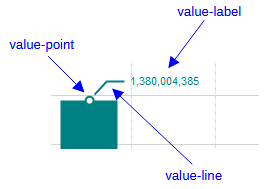
| exPoint | 1 | Specifies that the value-point is displayed. The valuePoint shape defines the visual appearance of the value-point. The AllowMoveValue property specifies the key combination that enables users to move or rearrange values within a series, as well as reorder entire series in the chart using drag-and-drop. | |||
| exLine | 2 | Specifies that the guided line to value is displayed. The valueLine shape defines the visual appearance of the guided line to value | |||
| exValue | 4 | Indicates that the value itself is shown | |||
| exHideIfEmpty | 128 | Hides the value-point, value-line and value itself if the value is empty | |||
| exHitTestRect | 256 | Specifies that the rectangle of a serie's data is included in hit testing when the pointer hovers over it. This means a value-point is considered "hit" not only when the pointer is directly over the point itself, but also when it hovers anywhere over the corresponding column or bar. This behavior applies to rectangular chart types, including "column", "rangeColumn", and "waterfall" |