| | Name | Value | Description | |
| |
exScatterPlotSize | 1
|
Specifies the radius to show the plot on scatter-type charts. For
"bubble" chart- type, it defines the maximum radius to show the
bubbles within the chart.
- 128, defines the maximum radius to show the
bubbles within the chart ( for "bubble" chart- type only )
By default, the
exScatterPlotSize option is 6.

(numeric expression)
| |
| |
exCandleStickSize | 2
|
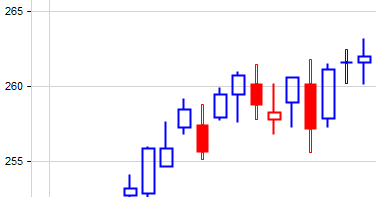
Specifies the size to display the candle-stick.
- 2, indicates a ticker candle line
By default, the
exCandleStickSize option is 1.
(numeric expression)
| |
| |
exCandleAllowHollow | 3
|
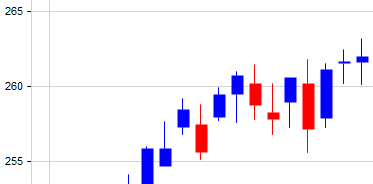
The
exCandleAllowHollow feature denotes that the "candleStick" or "ohlc" chart type enables the presentation of hollow representations. This indicates instances where the closing price exceeds the opening price, resulting in candlesticks characterized by unfilled bodies.
- false, disable hallow feature
By default, the
exCandleAllowHollow option is true.
(boolean expression)
| |
| |
exSplineTension | 4
|
Controls the tightness or looseness of the curve between control points (a higher tension value will result in a tighter curve, whereas a lower tension value will produce a more relaxed curve).
The Style
property indicates the way the values of the serie get connected.
- 1, the curve exhibits a rectangular shape rather than being rounded.
By default, the
exSplineTension option is 0.0.

(numeric expression between 0 and 1)
| |
| |
exSplineAlpha | 5
|
Serves as a tension control, influencing the curvature of the resulting spline between control points (a higher alpha value leads to a smoother curve, while a lower value produces a more rigid interpolation that closely follows the control points).
The Style
property indicates the way the values of the serie get connected.
- 1, the curve is characterized by more tension
By default, the
exSplineAlpha option is 0.5.

(numeric expression between 0 and 1)
| |
| |
exLineSize | 6
|
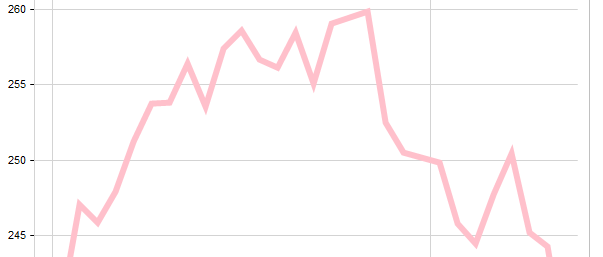
Specifies the size of the line (frame). The Type
property defines the type of the serie. The
exLineSize property specifies the size for linear chart-types such as
"line", "radarLine", ... or the size of the frame around the
pies for "pie" chart-types
- 4, indicates a ticker line
By default, the
exLineSize option is 1.
(numeric expression)
| |
| |
exPieFrameColor | 7
|
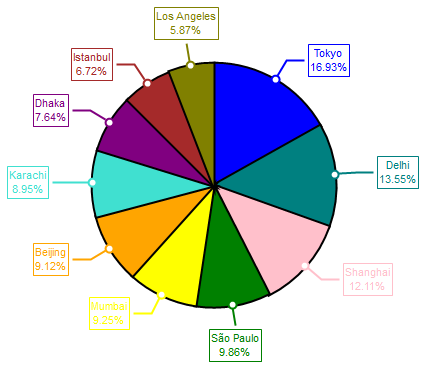
Indicates the color to show the frame around the pies. This color property accepts
values in various formats: CSS named colors, RGB format (e.g., rgb(red, green,
blue)), or hexadecimal format (#RRGGBB). In RGB format, the red, green, and blue
values range from 0 to 255, while in hexadecimal format, RR, GG, and BB
represent the hexadecimal values of the red, green, and blue channels,
respectively. The Type
property defines the type of the serie. The
exPieFrameColor property defines the color to show the frame around the pies,
for "pie" chart-types
- "black", shows the frame around the
pies in black
By default, the
exPieFrameColor option is "white".
(string expression)
| |
| |
exLineStyle | 8
|
Specifies the style of the line (frame) as one of the following values:
- 0, solid
- 1, dash
- 2, dot
- 3, dash-dot
- 4, dash-dot-dot
. The Type
property defines the type of the serie. The
exLineStyle property specifies the style for linear chart-types such as
"line", "radarLine", ... or the size of the frame around the
pies for "pie" chart-types
- 2, indicates a dotted line
By default, the
exLineStyle option is 0 (solid).
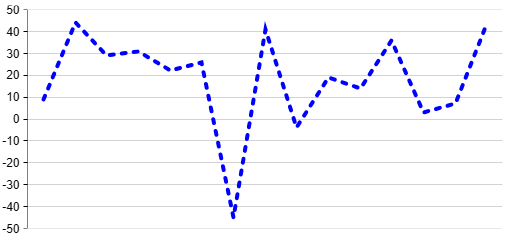
(numeric expression)
| |


