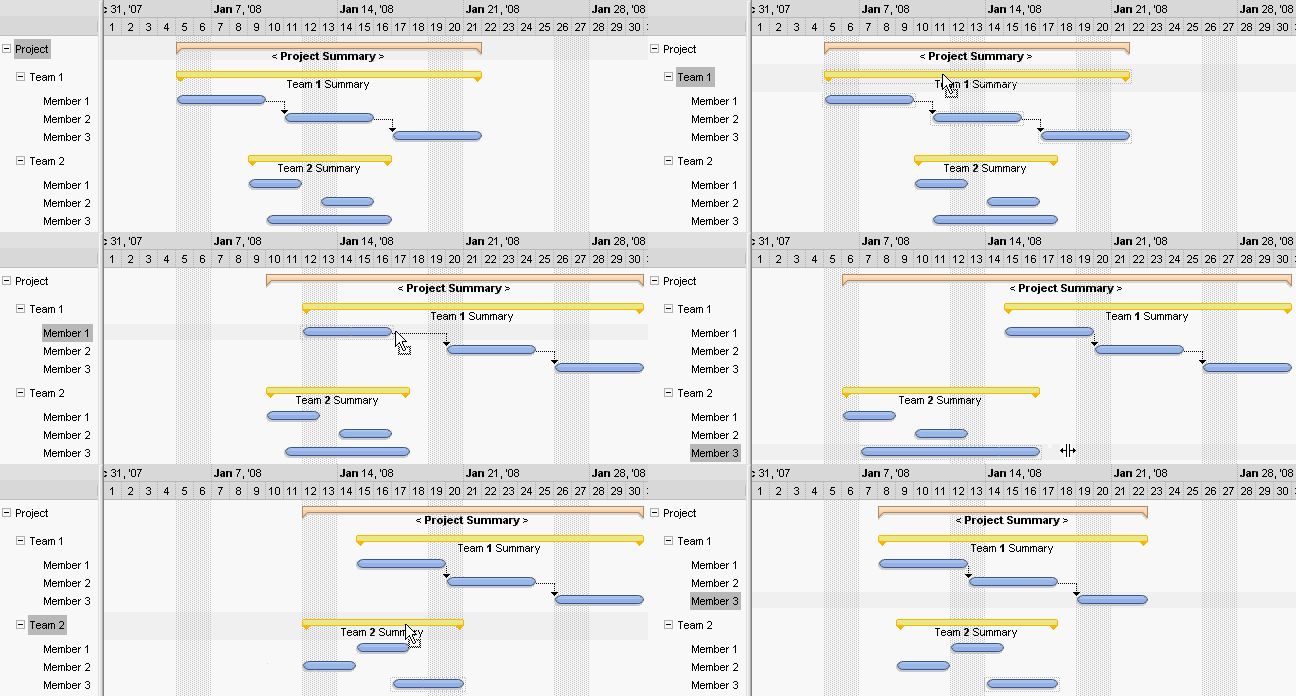
The DefineSummaryBars method defines bars being displayed under a summary bar. Once a bar that's included in a summary bar is moved or resized, its summary bar is automatically updated. Once a summary bar is moved all included bars are moved too. For instance, if your chart displays a "Summary" or "Project Summary" predefined bar, you can use the DefineSummaryBars method to define the bars included in the summary bar, so they automatically update the summary bars when moving or resizing. The DefineSummaryBars method defines a group of bars that belongs to another bar ( called summary bar ), so the margins of the summary bars are min and max of the margins of included bars. The margins of the bars are determined by ItemBar(exBarStart) and ItemBar(exBarEnd). The UndefineSummaryBars method does the reverse operation, as it removes a bar from a summary bar. Use the GroupBars method to group one or more bars. The ItemBar(exSummaryBarBackColor) property specifies the background color for the child bars in the summary bar portion.
For instance, in the following screen shot, the "< Project Summary >" is a summary bar for "Team 1 Summary" and "Team 2 Summary". The "Team 1 Summary" is a summary bar for all child bas being displayed under the Team 1 item. The "Team 2 Summary" is a summary bar for all child bas being displayed under the Team 2 item. Once a bar is moved, the owner summary bar is updated accordingly.

The following VB sample adds a "Summary" bar that includes 2 "Task" bars:
With G2antt1
	.BeginUpdate
	.Columns.Add "Tasks"
	With .Chart
		.FirstVisibleDate = #6/20/2005#
		.LevelCount = 2
	End With
	With .Items
		h = .AddItem("Project")
		.AddBar h,"Summary",#6/22/2005#,#6/23/2005 4:00:00 PM#
		h1 = .InsertItem(h,0,"Task 1")
		.AddBar h1,"Task",#6/21/2005 4:00:00 PM#,#6/23/2005#
		.ItemBar(h1,"",exBarHAlignCaption) = 18
		.DefineSummaryBars h,"",h1,""
		h2 = .InsertItem(h,0,"Task 2")
		.AddBar h2,"Task",#6/23/2005 8:00:00 AM#,#6/25/2005#
		.DefineSummaryBars h,"",h2,""
		.ExpandItem(h) = True
	End With
	.EndUpdate
End With
The following VB.NET sample adds a "Summary" bar that includes 2 "Task" bars:
Dim h,h1,h2
With AxG2antt1
	.BeginUpdate
	.Columns.Add "Tasks"
	With .Chart
		.FirstVisibleDate = #6/20/2005#
		.LevelCount = 2
	End With
	With .Items
		h = .AddItem("Project")
		.AddBar h,"Summary",#6/22/2005#,#6/23/2005 4:00:00 PM#
		h1 = .InsertItem(h,0,"Task 1")
		.AddBar h1,"Task",#6/21/2005 4:00:00 PM#,#6/23/2005#
		.ItemBar(h1,"",EXG2ANTTLib.ItemBarPropertyEnum.exBarHAlignCaption) = 18
		.DefineSummaryBars h,"",h1,""
		h2 = .InsertItem(h,0,"Task 2")
		.AddBar h2,"Task",#6/23/2005 8:00:00 AM#,#6/25/2005#
		.DefineSummaryBars h,"",h2,""
		.ExpandItem(h) = True
	End With
	.EndUpdate
End With
The following C# sample adds a "Summary" bar that includes 2 "Task" bars:
axG2antt1.BeginUpdate();
axG2antt1.Columns.Add("Tasks");
EXG2ANTTLib.Chart var_Chart = axG2antt1.Chart;
	var_Chart.FirstVisibleDate = "6/20/2005";
	var_Chart.LevelCount = 2;
EXG2ANTTLib.Items var_Items = axG2antt1.Items;
	int h = var_Items.AddItem("Project");
	var_Items.AddBar(h,"Summary","6/22/2005","6/23/2005 4:00:00 PM",null,null);
	int h1 = var_Items.InsertItem(h,0,"Task 1");
	var_Items.AddBar(h1,"Task","6/21/2005 4:00:00 PM","6/23/2005",null,null);
	var_Items.set_ItemBar(h1,"",EXG2ANTTLib.ItemBarPropertyEnum.exBarHAlignCaption,18);
	var_Items.DefineSummaryBars(h,"",h1,"");
	int h2 = var_Items.InsertItem(h,0,"Task 2");
	var_Items.AddBar(h2,"Task","6/23/2005 8:00:00 AM","6/25/2005",null,null);
	var_Items.DefineSummaryBars(h,"",h2,"");
	var_Items.set_ExpandItem(h,true);
axG2antt1.EndUpdate();
The following C++ sample adds a "Summary" bar that includes 2 "Task" bars:
/*
	Copy and paste the following directives to your header file as
	it defines the namespace 'EXG2ANTTLib' for the library: 'ExG2antt 1.0 Control Library'

	#import "d:\\Exontrol\\ExG2antt\\project\\Demo\\ExG2antt.dll"
	using namespace EXG2ANTTLib;
*/
EXG2ANTTLib::IG2anttPtr spG2antt1 = GetDlgItem(IDC_G2ANTT1)->GetControlUnknown();
spG2antt1->BeginUpdate();
spG2antt1->GetColumns()->Add(L"Tasks");
EXG2ANTTLib::IChartPtr var_Chart = spG2antt1->GetChart();
	var_Chart->PutFirstVisibleDate("6/20/2005");
	var_Chart->PutLevelCount(2);
EXG2ANTTLib::IItemsPtr var_Items = spG2antt1->GetItems();
	long h = var_Items->AddItem("Project");
	var_Items->AddBar(h,"Summary","6/22/2005","6/23/2005 4:00:00 PM",vtMissing,vtMissing);
	long h1 = var_Items->InsertItem(h,long(0),"Task 1");
	var_Items->AddBar(h1,"Task","6/21/2005 4:00:00 PM","6/23/2005",vtMissing,vtMissing);
	var_Items->PutItemBar(h1,"",EXG2ANTTLib::exBarHAlignCaption,long(18));
	var_Items->DefineSummaryBars(h,"",h1,"");
	long h2 = var_Items->InsertItem(h,long(0),"Task 2");
	var_Items->AddBar(h2,"Task","6/23/2005 8:00:00 AM","6/25/2005",vtMissing,vtMissing);
	var_Items->DefineSummaryBars(h,"",h2,"");
	var_Items->PutExpandItem(h,VARIANT_TRUE);
spG2antt1->EndUpdate();
The following VFP sample adds a "Summary" bar that includes 2 "Task" bars:
with thisform.G2antt1
	.BeginUpdate
	.Columns.Add("Tasks")
	with .Chart
		.FirstVisibleDate = {^2005-6-20}
		.LevelCount = 2
	endwith
	with .Items
		h = .AddItem("Project")
		.AddBar(h,"Summary",{^2005-6-22},{^2005-6-23 16:00:00})
		h1 = .InsertItem(h,0,"Task 1")
		.AddBar(h1,"Task",{^2005-6-21 16:00:00},{^2005-6-23})
		.ItemBar(h1,"",4) = 18
		.DefineSummaryBars(h,"",h1,"")
		h2 = .InsertItem(h,0,"Task 2")
		.AddBar(h2,"Task",{^2005-6-23 8:00:00},{^2005-6-25})
		.DefineSummaryBars(h,"",h2,"")
		.ExpandItem(h) = .T.
	endwith
	.EndUpdate
endwith

