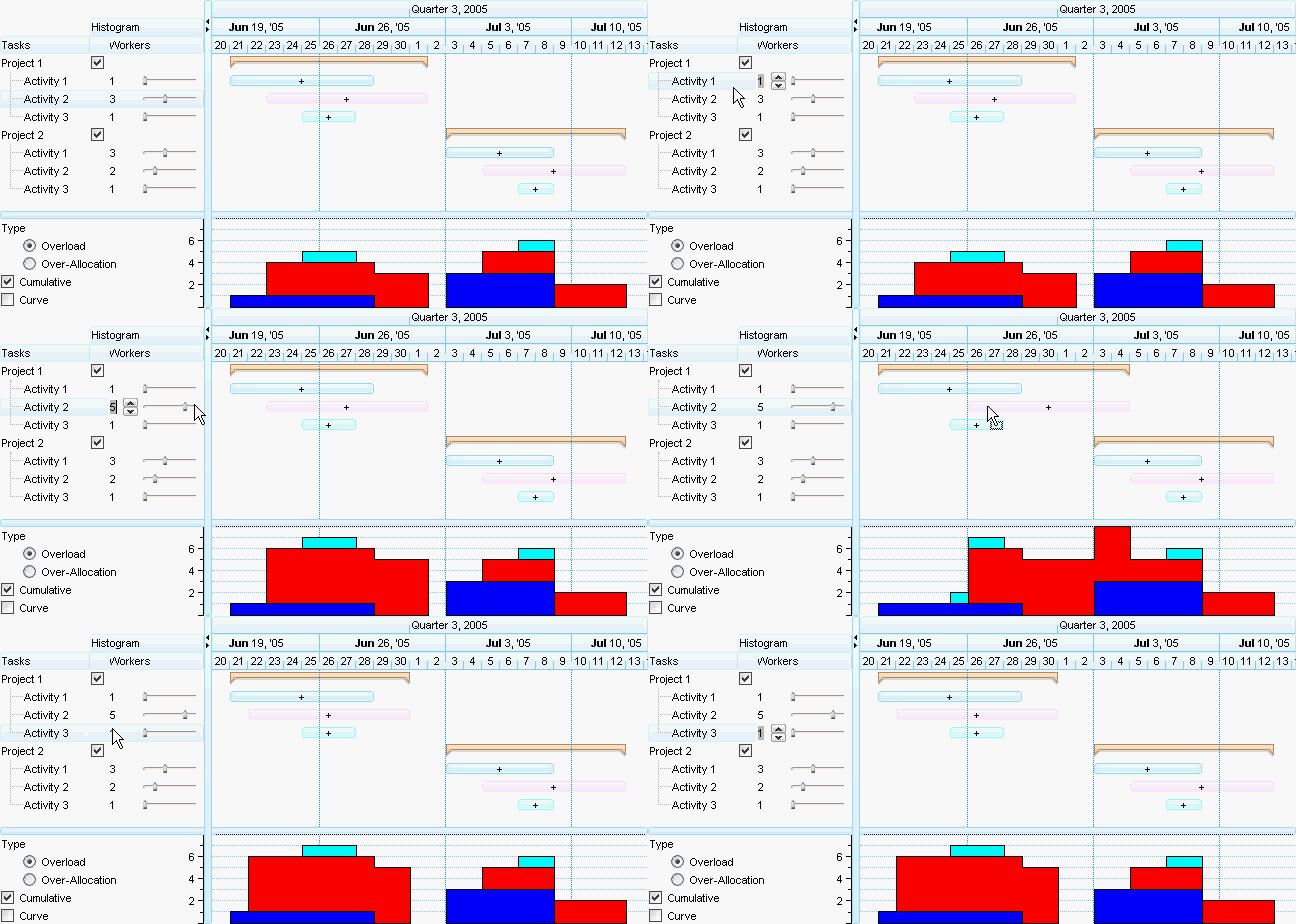
By default, the AllowCellValueToItemBar property is False. In other words, if there is any association between a cell and a property bar they do not have any effect, while the AllowCellValueToItemBar property is False. The AllowCellValueToItemBar property allows the cells to display properties of the bars, and the property of the bar to be specified by the cell's value. For example, you can utilize the CellValueToItemBar feature to show the start and end dates of any bar within the item, whether for an entire column or in specific cells. The values in the cells will automatically update when the bar is resized or moved. Similarly, if the value in the cell is changed, the corresponding bar will be resized or repositioned accordingly.
By default, the control uses the AllowCellValueToItemBar feature that connects cells in a data grid (like a table) to bars in a chart or visual representation. When this feature is enabled, it allows the following:
- Display of Information: Cells can show specific information, such as the start and end dates of a bar. For example, if a bar represents a project timeline, the cells might display the project's start and end dates.
- Automatic Updates: When the size or position of the bar changesólike if you resize it or move itóthe information in the connected cells updates automatically to reflect those changes. This ensures that the data remains consistent.
- Interactive Changes: If you change the value in a cell (for instance, updating a date), the associated bar will also adjust itself. This means the bar will either resize or reposition itself based on the new value in the cell, maintaining the relationship between the two.
In summary, the AllowCellValueToItemBar feature creates a dynamic link between cells and bars, allowing them to reflect each other's data changes, making it easier to visualize and manage the information.
The cell's value can be associated with any property of the bar, using the:
- Def(exCellValueToItemBarProperty/exCellValueToItemBarKey) property of the Column object, that defines a relation/association between specified property bar and the cells in the column. For instance, the .Def(exCellValueToItemBarProperty) = 1 indicates that the column displays the property of the bar with the index 1, which is exBarStart or .Def(exCellValueToItemBarProperty) = 543, displays the exBarEndInclusive property of the bar.
- CellValueToItemBar method of the Items object, that associates the cell's value with any property of the bar in the item.
Once an association between a cell and a bar is made, the CellValue property and ItemBar property returns the same result, or in other words, changing the cell's value will be reflected in the bar's property, and back, so changing the bar's property will change the cell's value.
The following screen shot shows the association between ItemBar(exBarEffort) property of the bar with the cell in last column, so changing it is automatically reflected in the chart's histogram :

The following VB sample display automatically the start and end dates of the bars in the Start and End columns:
With G2antt1
	.BeginUpdate
	With .Columns
		.Add "Tasks"
		With .Add("Start")
			.Def(exCellValueToItemBarProperty) = 1
			.Editor.EditType = DateType
		End With
		With .Add("End")
			.Def(exCellValueToItemBarProperty) = 2
			.Editor.EditType = DateType
		End With
	End With
	With .Chart
		.FirstVisibleDate = #9/20/2006#
		.AllowLinkBars = True
		.AllowCreateBar = exNoCreateBar
		.LevelCount = 2
		.PaneWidth(0) = 196
	End With
	With .Items
		.AllowCellValueToItemBar = True
		.AddBar .AddItem("Task 1"),"Task",#9/21/2006#,#9/24/2006#
		.AddBar .AddItem("Task 2"),"Task",#9/22/2006#,#9/25/2006#
		.AddBar .AddItem("Task 3"),"Task",#9/23/2006#,#9/26/2006#
	End With
	.EndUpdate
End With
The following VB.NET sample display automatically the start and end dates of the bars in the Start and End columns:
With AxG2antt1
	.BeginUpdate
	With .Columns
		.Add "Tasks"
		With .Add("Start")
			.Def(EXG2ANTTLib.DefColumnEnum.exCellValueToItemBarProperty) = 1
			.Editor.EditType = EXG2ANTTLib.EditTypeEnum.DateType
		End With
		With .Add("End")
			.Def(EXG2ANTTLib.DefColumnEnum.exCellValueToItemBarProperty) = 2
			.Editor.EditType = EXG2ANTTLib.EditTypeEnum.DateType
		End With
	End With
	With .Chart
		.FirstVisibleDate = #9/20/2006#
		.AllowLinkBars = True
		.AllowCreateBar = EXG2ANTTLib.CreateBarEnum.exNoCreateBar
		.LevelCount = 2
		.PaneWidth(0) = 196
	End With
	With .Items
		.AllowCellValueToItemBar = True
		.AddBar .AddItem("Task 1"),"Task",#9/21/2006#,#9/24/2006#
		.AddBar .AddItem("Task 2"),"Task",#9/22/2006#,#9/25/2006#
		.AddBar .AddItem("Task 3"),"Task",#9/23/2006#,#9/26/2006#
	End With
	.EndUpdate
End With
The following C++ sample display automatically the start and end dates of the bars in the Start and End columns:
/*
	Copy and paste the following directives to your header file as
	it defines the namespace 'EXG2ANTTLib' for the library: 'ExG2antt 1.0 Control Library'

	#import <ExG2antt.dll>
	using namespace EXG2ANTTLib;
*/
EXG2ANTTLib::IG2anttPtr spG2antt1 = GetDlgItem(IDC_G2ANTT1)->GetControlUnknown();
spG2antt1->BeginUpdate();
EXG2ANTTLib::IColumnsPtr var_Columns = spG2antt1->GetColumns();
	var_Columns->Add(L"Tasks");
	EXG2ANTTLib::IColumnPtr var_Column = ((EXG2ANTTLib::IColumnPtr)(var_Columns->Add(L"Start")));
		var_Column->PutDef(EXG2ANTTLib::exCellValueToItemBarProperty,long(1));
		var_Column->GetEditor()->PutEditType(EXG2ANTTLib::DateType);
	EXG2ANTTLib::IColumnPtr var_Column1 = ((EXG2ANTTLib::IColumnPtr)(var_Columns->Add(L"End")));
		var_Column1->PutDef(EXG2ANTTLib::exCellValueToItemBarProperty,long(2));
		var_Column1->GetEditor()->PutEditType(EXG2ANTTLib::DateType);
EXG2ANTTLib::IChartPtr var_Chart = spG2antt1->GetChart();
	var_Chart->PutFirstVisibleDate("9/20/2006");
	var_Chart->PutAllowLinkBars(VARIANT_TRUE);
	var_Chart->PutAllowCreateBar(EXG2ANTTLib::exNoCreateBar);
	var_Chart->PutLevelCount(2);
	var_Chart->PutPaneWidth(0,196);
EXG2ANTTLib::IItemsPtr var_Items = spG2antt1->GetItems();
	var_Items->PutAllowCellValueToItemBar(VARIANT_TRUE);
	var_Items->AddBar(var_Items->AddItem("Task 1"),"Task","9/21/2006","9/24/2006",vtMissing,vtMissing);
	var_Items->AddBar(var_Items->AddItem("Task 2"),"Task","9/22/2006","9/25/2006",vtMissing,vtMissing);
	var_Items->AddBar(var_Items->AddItem("Task 3"),"Task","9/23/2006","9/26/2006",vtMissing,vtMissing);
spG2antt1->EndUpdate();
The following C# sample display automatically the start and end dates of the bars in the Start and End columns:
axG2antt1.BeginUpdate();
EXG2ANTTLib.Columns var_Columns = axG2antt1.Columns;
	var_Columns.Add("Tasks");
	EXG2ANTTLib.Column var_Column = (var_Columns.Add("Start") as EXG2ANTTLib.Column);
		var_Column.set_Def(EXG2ANTTLib.DefColumnEnum.exCellValueToItemBarProperty,1);
		var_Column.Editor.EditType = EXG2ANTTLib.EditTypeEnum.DateType;
	EXG2ANTTLib.Column var_Column1 = (var_Columns.Add("End") as EXG2ANTTLib.Column);
		var_Column1.set_Def(EXG2ANTTLib.DefColumnEnum.exCellValueToItemBarProperty,2);
		var_Column1.Editor.EditType = EXG2ANTTLib.EditTypeEnum.DateType;
EXG2ANTTLib.Chart var_Chart = axG2antt1.Chart;
	var_Chart.FirstVisibleDate = "9/20/2006";
	var_Chart.AllowLinkBars = true;
	var_Chart.AllowCreateBar = EXG2ANTTLib.CreateBarEnum.exNoCreateBar;
	var_Chart.LevelCount = 2;
	var_Chart.set_PaneWidth(0 != 0,196);
EXG2ANTTLib.Items var_Items = axG2antt1.Items;
	var_Items.AllowCellValueToItemBar = true;
	var_Items.AddBar(var_Items.AddItem("Task 1"),"Task","9/21/2006","9/24/2006",null,null);
	var_Items.AddBar(var_Items.AddItem("Task 2"),"Task","9/22/2006","9/25/2006",null,null);
	var_Items.AddBar(var_Items.AddItem("Task 3"),"Task","9/23/2006","9/26/2006",null,null);
axG2antt1.EndUpdate();
The following VFP sample display automatically the start and end dates of the bars in the Start and End columns:
with thisform.G2antt1
	.BeginUpdate
	with .Columns
		.Add("Tasks")
		with .Add("Start")
			.Def(18) = 1
			.Editor.EditType = 7
		endwith
		with .Add("End")
			.Def(18) = 2
			.Editor.EditType = 7
		endwith
	endwith
	with .Chart
		.FirstVisibleDate = {^2006-9-20}
		.AllowLinkBars = .T.
		.AllowCreateBar = 0
		.LevelCount = 2
		.PaneWidth(0) = 196
	endwith
	with .Items
		.AllowCellValueToItemBar = .T.
		.AddBar(.AddItem("Task 1"),"Task",{^2006-9-21},{^2006-9-24})
		.AddBar(.AddItem("Task 2"),"Task",{^2006-9-22},{^2006-9-25})
		.AddBar(.AddItem("Task 3"),"Task",{^2006-9-23},{^2006-9-26})
	endwith
	.EndUpdate
endwith
The following Delphi sample display automatically the start and end dates of the bars in the Start and End columns:
with AxG2antt1 do
begin
	BeginUpdate();
	with Columns do
	begin
		Add('Tasks');
		with (Add('Start') as EXG2ANTTLib.Column) do
		begin
			Def[EXG2ANTTLib.DefColumnEnum.exCellValueToItemBarProperty] := TObject(1);
			Editor.EditType := EXG2ANTTLib.EditTypeEnum.DateType;
		end;
		with (Add('End') as EXG2ANTTLib.Column) do
		begin
			Def[EXG2ANTTLib.DefColumnEnum.exCellValueToItemBarProperty] := TObject(2);
			Editor.EditType := EXG2ANTTLib.EditTypeEnum.DateType;
		end;
	end;
	with Chart do
	begin
		FirstVisibleDate := '9/20/2006';
		AllowLinkBars := True;
		AllowCreateBar := EXG2ANTTLib.CreateBarEnum.exNoCreateBar;
		LevelCount := 2;
		PaneWidth[0 <> 0] := 196;
	end;
	with Items do
	begin
		AllowCellValueToItemBar := True;
		AddBar(AddItem('Task 1'),'Task','9/21/2006','9/24/2006',Nil,Nil);
		AddBar(AddItem('Task 2'),'Task','9/22/2006','9/25/2006',Nil,Nil);
		AddBar(AddItem('Task 3'),'Task','9/23/2006','9/26/2006',Nil,Nil);
	end;
	EndUpdate();
end

