

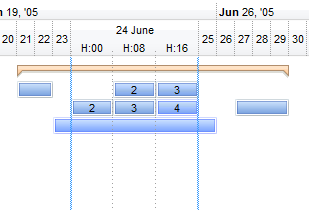
The following screen shot shows the hours being displayed from 8 to 8 hours:
With G2antt1
	.BeginUpdate
	With .Chart
		.PaneWidth(0) = 0
		.LevelCount = 2
		.FirstVisibleDate = #1/1/2008#
		.AllowInsideZoom = True
		With .DefaultInsideZoomFormat
			.InsideLabel = "H: <b><%hh%></b>"
			.InsideUnit = exHour
			.InsideCount = 8
		End With
		With .InsideZooms
			.Add #1/4/2008#
		End With
	End With
	.EndUpdate
End With
The following VB.NET sample shows how can I zoom or magnify the selected date to display the hours, from 8 to 8:
With AxG2antt1
	.BeginUpdate
	With .Chart
		.PaneWidth(0) = 0
		.LevelCount = 2
		.FirstVisibleDate = #1/1/2008#
		.AllowInsideZoom = True
		With .DefaultInsideZoomFormat
			.InsideLabel = "H: <b><%hh%></b>"
			.InsideUnit = EXG2ANTTLib.UnitEnum.exHour
			.InsideCount = 8
		End With
		With .InsideZooms
			.Add #1/4/2008#
		End With
	End With
	.EndUpdate
End With
The following C++ sample shows how can I zoom or magnify the selected date to display the hours, from 8 to 8:
/*
	Copy and paste the following directives to your header file as
	it defines the namespace 'EXG2ANTTLib' for the library: 'ExG2antt 1.0 Control Library'

	#import <ExG2antt.dll>
	using namespace EXG2ANTTLib;
*/
EXG2ANTTLib::IG2anttPtr spG2antt1 = GetDlgItem(IDC_G2ANTT1)->GetControlUnknown();
spG2antt1->BeginUpdate();
EXG2ANTTLib::IChartPtr var_Chart = spG2antt1->GetChart();
	var_Chart->PutPaneWidth(0,0);
	var_Chart->PutLevelCount(2);
	var_Chart->PutFirstVisibleDate("1/1/2008");
	var_Chart->PutAllowInsideZoom(VARIANT_TRUE);
	EXG2ANTTLib::IInsideZoomFormatPtr var_InsideZoomFormat = var_Chart->GetDefaultInsideZoomFormat();
		var_InsideZoomFormat->PutInsideLabel(L"H: <b><%hh%></b>");
		var_InsideZoomFormat->PutInsideUnit(EXG2ANTTLib::exHour);
		var_InsideZoomFormat->PutInsideCount(8);
	EXG2ANTTLib::IInsideZoomsPtr var_InsideZooms = var_Chart->GetInsideZooms();
		var_InsideZooms->Add("1/4/2008");
spG2antt1->EndUpdate();
The following C# sample shows how can I zoom or magnify the selected date to display the hours, from 8 to 8:
axG2antt1.BeginUpdate();
EXG2ANTTLib.Chart var_Chart = axG2antt1.Chart;
	var_Chart.set_PaneWidth(0 != 0,0);
	var_Chart.LevelCount = 2;
	var_Chart.FirstVisibleDate = "1/1/2008";
	var_Chart.AllowInsideZoom = true;
	EXG2ANTTLib.InsideZoomFormat var_InsideZoomFormat = var_Chart.DefaultInsideZoomFormat;
		var_InsideZoomFormat.InsideLabel = "H: <b><%hh%></b>";
		var_InsideZoomFormat.InsideUnit = EXG2ANTTLib.UnitEnum.exHour;
		var_InsideZoomFormat.InsideCount = 8;
	EXG2ANTTLib.InsideZooms var_InsideZooms = var_Chart.InsideZooms;
		var_InsideZooms.Add("1/4/2008");
axG2antt1.EndUpdate();
The following VFP sample shows how can I zoom or magnify the selected date to display the hours, from 8 to 8:
with thisform.G2antt1
	.BeginUpdate
	with .Chart
		.PaneWidth(0) = 0
		.LevelCount = 2
		.FirstVisibleDate = {^2008-1-1}
		.AllowInsideZoom = .T.
		with .DefaultInsideZoomFormat
			.InsideLabel = "H: <b><%hh%></b>"
			.InsideUnit = 65536
			.InsideCount = 8
		endwith
		with .InsideZooms
			.Add({^2008-1-4})
		endwith
	endwith
	.EndUpdate
endwith