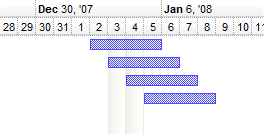
The following screen shot shows the selected dates ( Dec 2 and Dec 4 ) being colored with this EBN file:

The following VB sample shows how you can use skin / ebn files to display the selected dates:
With G2antt1
	.BeginUpdate
	With .VisualAppearance
		.Add 1,"c:\exontrol\images\normal.ebn"
	End With
	With .Chart
		.FirstVisibleDate = #1/1/2008#
		.MarkTodayColor = .BackColor
		.LevelCount = 2
		.MarkSelectDateColor = 0x1000000
		.SelectLevel = 1
		.SelectDate(#1/3/2008#) = True
		.SelectDate(#1/4/2008#) = True
	End With
	.Columns.Add "Default"
	With .Items
		.AddBar .AddItem("Item 1"),"Task",#1/2/2008#,#1/6/2008#
		.AddBar .AddItem("Item 2"),"Task",#1/3/2008#,#1/7/2008#
		.AddBar .AddItem("Item 3"),"Task",#1/4/2008#,#1/8/2008#
		.AddBar .AddItem("Item 4"),"Task",#1/5/2008#,#1/9/2008#
	End With
	.EndUpdate
End With
The following VB.NET sample shows how you can use skin / ebn files to display the selected dates:
With AxG2antt1
	.BeginUpdate
	With .VisualAppearance
		.Add 1,"c:\exontrol\images\normal.ebn"
	End With
	With .Chart
		.FirstVisibleDate = #1/1/2008#
		.MarkTodayColor = .BackColor
		.LevelCount = 2
		.MarkSelectDateColor = &H1000000
		.SelectLevel = 1
		.SelectDate(#1/3/2008#) = True
		.SelectDate(#1/4/2008#) = True
	End With
	.Columns.Add "Default"
	With .Items
		.AddBar .AddItem("Item 1"),"Task",#1/2/2008#,#1/6/2008#
		.AddBar .AddItem("Item 2"),"Task",#1/3/2008#,#1/7/2008#
		.AddBar .AddItem("Item 3"),"Task",#1/4/2008#,#1/8/2008#
		.AddBar .AddItem("Item 4"),"Task",#1/5/2008#,#1/9/2008#
	End With
	.EndUpdate
End With
The following C++ sample shows how you can use skin / ebn files to display the selected dates:
/*
	Copy and paste the following directives to your header file as
	it defines the namespace 'EXG2ANTTLib' for the library: 'ExG2antt 1.0 Control Library'

	#import <ExG2antt.dll>
	using namespace EXG2ANTTLib;
*/
EXG2ANTTLib::IG2anttPtr spG2antt1 = GetDlgItem(IDC_G2ANTT1)->GetControlUnknown();
spG2antt1->BeginUpdate();
EXG2ANTTLib::IAppearancePtr var_Appearance = spG2antt1->GetVisualAppearance();
	var_Appearance->Add(1,"c:\\exontrol\\images\\normal.ebn");
EXG2ANTTLib::IChartPtr var_Chart = spG2antt1->GetChart();
	var_Chart->PutFirstVisibleDate("1/1/2008");
	var_Chart->PutMarkTodayColor(var_Chart->GetBackColor());
	var_Chart->PutLevelCount(2);
	var_Chart->PutMarkSelectDateColor(0x1000000);
	var_Chart->PutSelectLevel(1);
	var_Chart->PutSelectDate("1/3/2008",VARIANT_TRUE);
	var_Chart->PutSelectDate("1/4/2008",VARIANT_TRUE);
spG2antt1->GetColumns()->Add(L"Default");
EXG2ANTTLib::IItemsPtr var_Items = spG2antt1->GetItems();
	var_Items->AddBar(var_Items->AddItem("Item 1"),"Task","1/2/2008","1/6/2008",vtMissing,vtMissing);
	var_Items->AddBar(var_Items->AddItem("Item 2"),"Task","1/3/2008","1/7/2008",vtMissing,vtMissing);
	var_Items->AddBar(var_Items->AddItem("Item 3"),"Task","1/4/2008","1/8/2008",vtMissing,vtMissing);
	var_Items->AddBar(var_Items->AddItem("Item 4"),"Task","1/5/2008","1/9/2008",vtMissing,vtMissing);
spG2antt1->EndUpdate();
The following C# sample shows how you can use skin / ebn files to display the selected dates:
axG2antt1.BeginUpdate();
EXG2ANTTLib.Appearance var_Appearance = axG2antt1.VisualAppearance;
	var_Appearance.Add(1,"c:\\exontrol\\images\\normal.ebn");
EXG2ANTTLib.Chart var_Chart = axG2antt1.Chart;
	var_Chart.FirstVisibleDate = "1/1/2008";
	var_Chart.MarkTodayColor = var_Chart.BackColor;
	var_Chart.LevelCount = 2;
	var_Chart.MarkSelectDateColor = 0x1000000;
	var_Chart.SelectLevel = 1;
	var_Chart.set_SelectDate("1/3/2008",true);
	var_Chart.set_SelectDate("1/4/2008",true);
axG2antt1.Columns.Add("Default");
EXG2ANTTLib.Items var_Items = axG2antt1.Items;
	var_Items.AddBar(var_Items.AddItem("Item 1"),"Task","1/2/2008","1/6/2008",null,null);
	var_Items.AddBar(var_Items.AddItem("Item 2"),"Task","1/3/2008","1/7/2008",null,null);
	var_Items.AddBar(var_Items.AddItem("Item 3"),"Task","1/4/2008","1/8/2008",null,null);
	var_Items.AddBar(var_Items.AddItem("Item 4"),"Task","1/5/2008","1/9/2008",null,null);
axG2antt1.EndUpdate();
The following VFP sample shows how you can use skin / ebn files to display the selected dates:
with thisform.G2antt1
	.BeginUpdate
	with .VisualAppearance
		.Add(1,"c:\exontrol\images\normal.ebn")
	endwith
	with .Chart
		.FirstVisibleDate = {^2008-1-1}
		.MarkTodayColor = .BackColor
		.LevelCount = 2
		.MarkSelectDateColor = 0x1000000
		.SelectLevel = 1
		.SelectDate({^2008-1-3}) = .T.
		.SelectDate({^2008-1-4}) = .T.
	endwith
	.Columns.Add("Default")
	with .Items
		.AddBar(.AddItem("Item 1"),"Task",{^2008-1-2},{^2008-1-6})
		.AddBar(.AddItem("Item 2"),"Task",{^2008-1-3},{^2008-1-7})
		.AddBar(.AddItem("Item 3"),"Task",{^2008-1-4},{^2008-1-8})
		.AddBar(.AddItem("Item 4"),"Task",{^2008-1-5},{^2008-1-9})
	endwith
	.EndUpdate
endwith

